Source: US FAA
U.S. airlines carried 51% fewer scheduled service passengers in March 2020 than in March 2019, according to preliminary data filed with the Bureau of Transportation Statistics (BTS) by 24 airlines that carry 99% of the passengers, dropping to the lowest level of air travel in more than two decades.
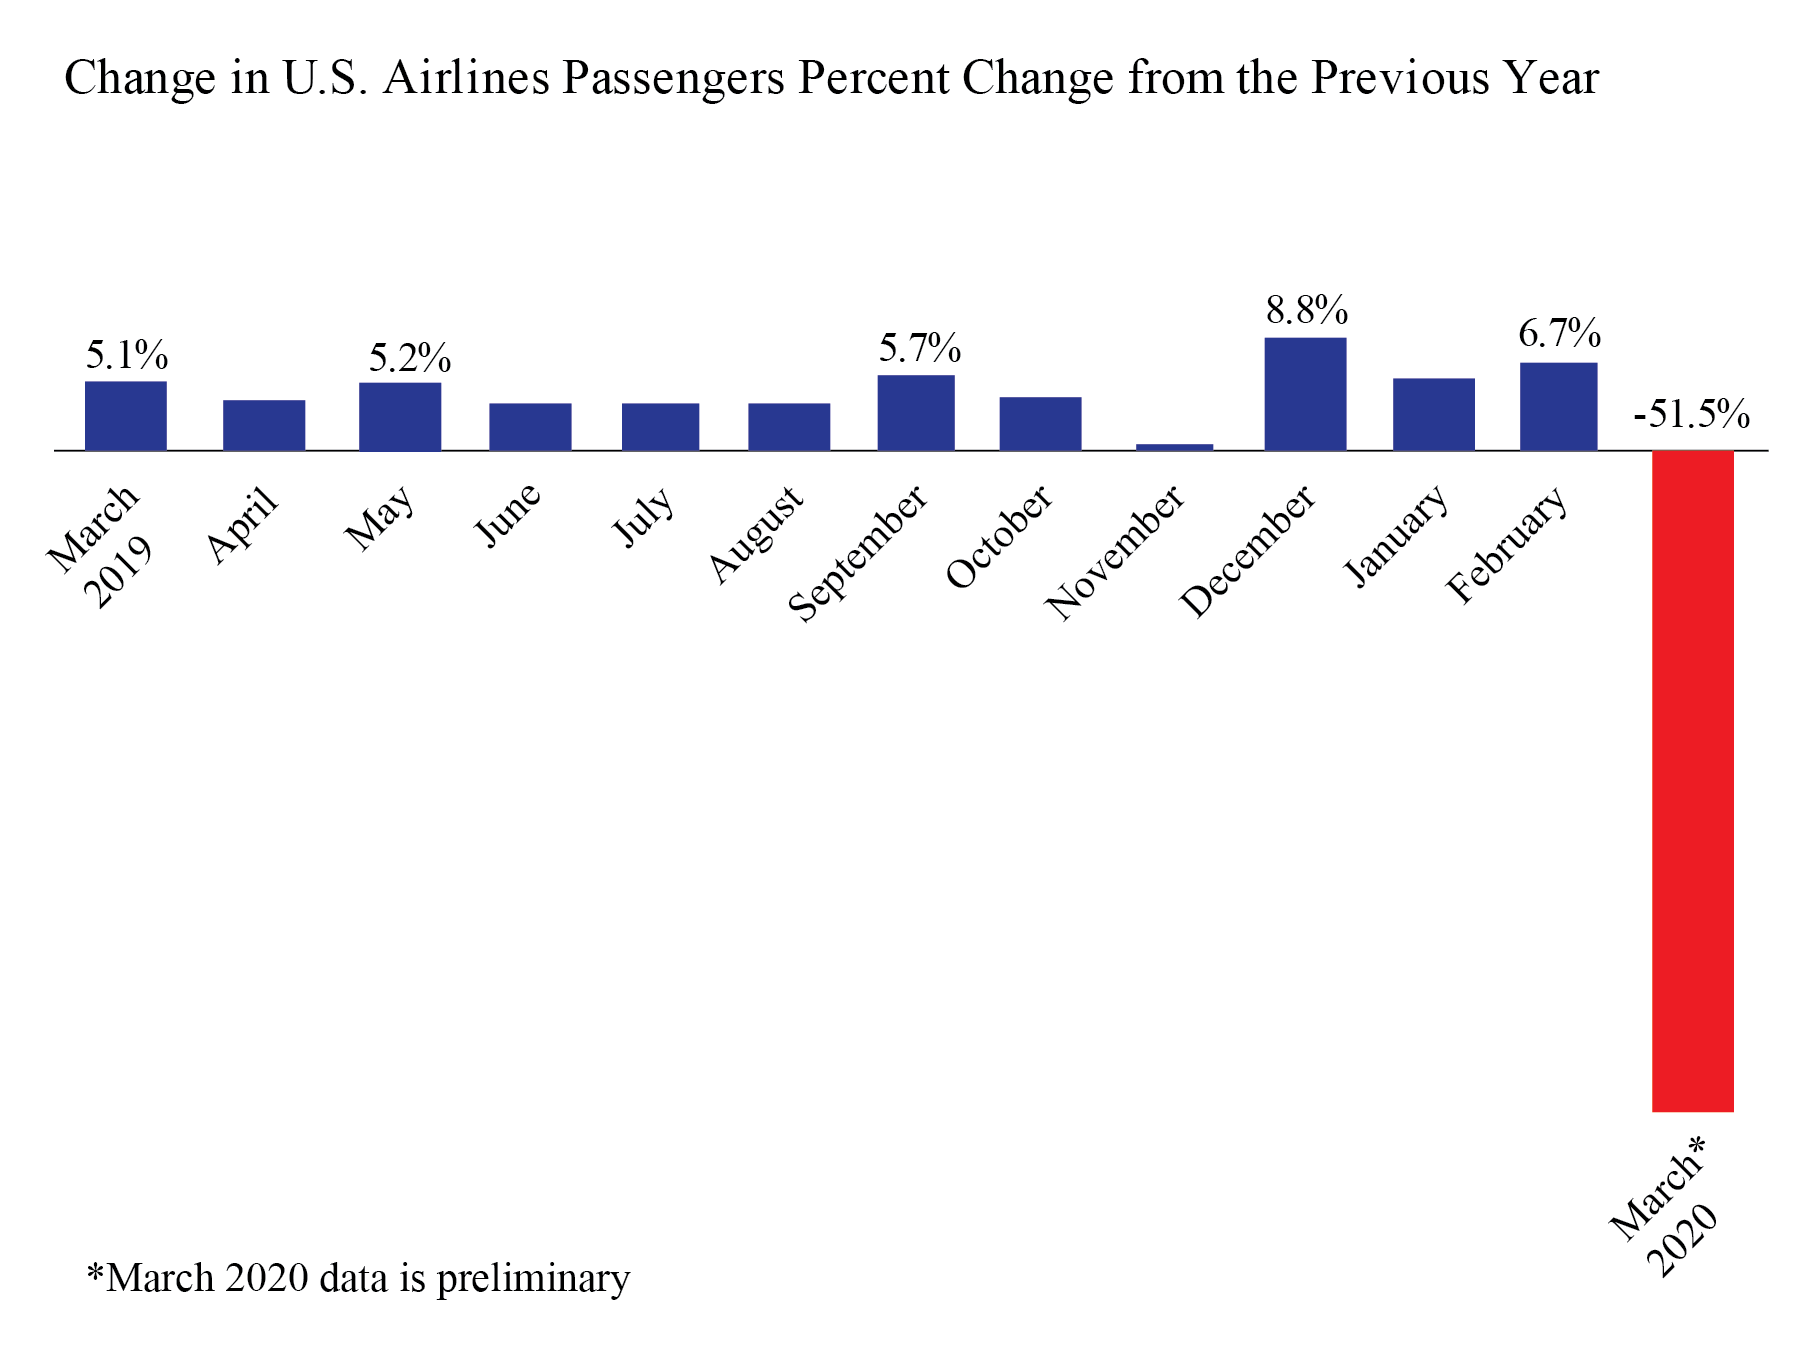
The 51% decline in the number of passengers from March 2019 was the largest year-to-year decrease on record.
The airlines carried slightly more total, domestic and international passengers in March 2020 than in September 2001, the month of the 9/11 terrorist attacks.
March 2020 passenger numbers (24 carriers reporting):
- Total: 7 million passengers, down 51% from March 2019 (79.9M)
- Domestic: 34.1 million passengers, down 51% from March 2019 (69.6M)
- International: 4.6 million passengers, down 53% from March 2019 (9.9M)
U.S. airline traffic reports are filed monthly with BTS. Final March data will be released on June 11. Complete international data by origin and destination, which is under a six-month confidentiality restriction, will be released on Sept. 11.
President Trump issued an order on Jan. 31 restricting travel to the U.S. from China. He issued an additional order on March 11 restricting travel to the U.S. from certain European countries.
Systemwide Passengers
The 51% decline in U.S. airlines passengers from March 2019 to March 2020 followed 29 consecutive months of increases from the same month of the previous year, dating back to October 2017.
Table 1: Systemwide Percent Change in US Airlines Scheduled Service Passengers from the Same Month of the Previous Year, 2016-2020
| Year-to-Year Percent Change | ||||
| 2016-2017 | 2017-2018 | 2018-2019 | 2019-2020 | |
| January |
3.0 |
2.9 | 4.0 | 5.6 |
| February | -0.2 | 5.7 | 3.0 | 6.7 |
| March | 3.4 | 4.6 | 5.1 | -51.5* |
| April | 4.5 | 4.8 | 3.8 | |
| May | 3.0 | 4.9 | 5.2 | |
| June | 3.4 | 5.0 | 3.7 | |
| July | 3.8 | 5.2 | 3.6 | |
| August | 5.0 | 5.0 | 3.4 | |
| September | -2.3 | 5.8 | 5.7 | |
| October | 4.6 | 3.9 | 4.1 | |
| November | 4.6 | 4.5 | 0.5 | |
| December | 3.5 | 3.6 | 8.8 | |
| Annual | 3.1 | 4.7 | 4.2 | |
Source: Bureau of Transportation Statistics, T-100 Market
* March 2020 data is preliminary
Domestic Passengers
The number of U.S. airlines domestic passengers declined 51% from March 2019 to March 2020 following 29 consecutive months of increases from the same month of the previous year, dating back to October 2017.
Table 2: Domestic Percent Change in US Airlines Scheduled Service Passengers from the Same Month of the Previous Year, 2016-2020
| Year-to-Year Percent Change | ||||
| 2016-2017 | 2017-2018 | 2018-2019 | 2019-2020 | |
| January | 3.1 | 3.2 | 3.9 | 6.2 |
| February | -0.1 | 5.9 | 3.0 | 7.4 |
| March | 3.8 | 4.2 | 5.4 | -51.0* |
| April | 3.7 | 5.7 | 3.7 | |
| May | 2.7 | 5.3 | 5.2 | |
| June | 3.1 | 5.3 | 3.6 | |
| July | 3.7 | 5.8 | 3.8 | |
| August | 5.0 | 5.5 | 3.4 | |
| September | -2.5 | 5.8 | 5.8 | |
| October | 4.7 | 3.8 | 4.2 | |
| November | 4.5 | 4.4 | 0.2 | |
| December | 3.7 | 3.7 | 9.5 | |
| Annual | 3.0 | 4.9 | 4.3 | |
Source: Bureau of Transportation Statistics, T-100 Domestic Market
* March 2020 data is preliminary
International Passengers
The number of U.S. airlines international passengers declined 53% from March 2019 to March 2020 following 22 consecutive months of increases from the same month of the previous year, dating back to May 2018.
Table 3: International Percent Change in US Airlines Scheduled Service Passengers from the Same Month of the Previous Year, 2016-2020
| Year-to-Year Percent Change | ||||
| 2016-2017 | 2017-2018 | 2018-2019 | 2019-2020 | |
| January | 2.1 | 1.0 | 4.5 | 1.9 |
| February | -1.2 | 4.6 | 3.4 | 0.7 |
| March | 0.4 | 7.2 | 3.4 | -53.3* |
| April | 9.8 | -1.0 | 4.6 | |
| May | 5.4 | 2.3 | 5.6 | |
| June | 5.3 | 3.4 | 4.2 | |
| July | 4.6 | 1.6 | 2.2 | |
| August | 4.9 | 2.0 | 3.9 | |
| September | -1.1 | 5.9 | 4.6 | |
| October | 3.2 | 4.3 | 3.2 | |
| November | 5.4 | 4.7 | 2.2 | |
| December | 1.7 | 3.2 | 3.6 | |
| Annual | 3.5 | 3.1 | 3.8 | |
Source: Bureau of Transportation Statistics, T-100 International Market
* March 2020 data is preliminary
Reporting Notes
Data are compiled from monthly reports filed with BTS by commercial U.S. air carriers detailing operations, passenger traffic and freight traffic. This release includes data received by BTS from 24 U.S. airlines as of May 5.
See the BTS Airlines and Airports page for additional U.S. airlines numbers through January for U.S. airlines. International data by origin and destination is available through October.
BTS has scheduled May 14 for the release of final reported data for February.