Source: US DOT
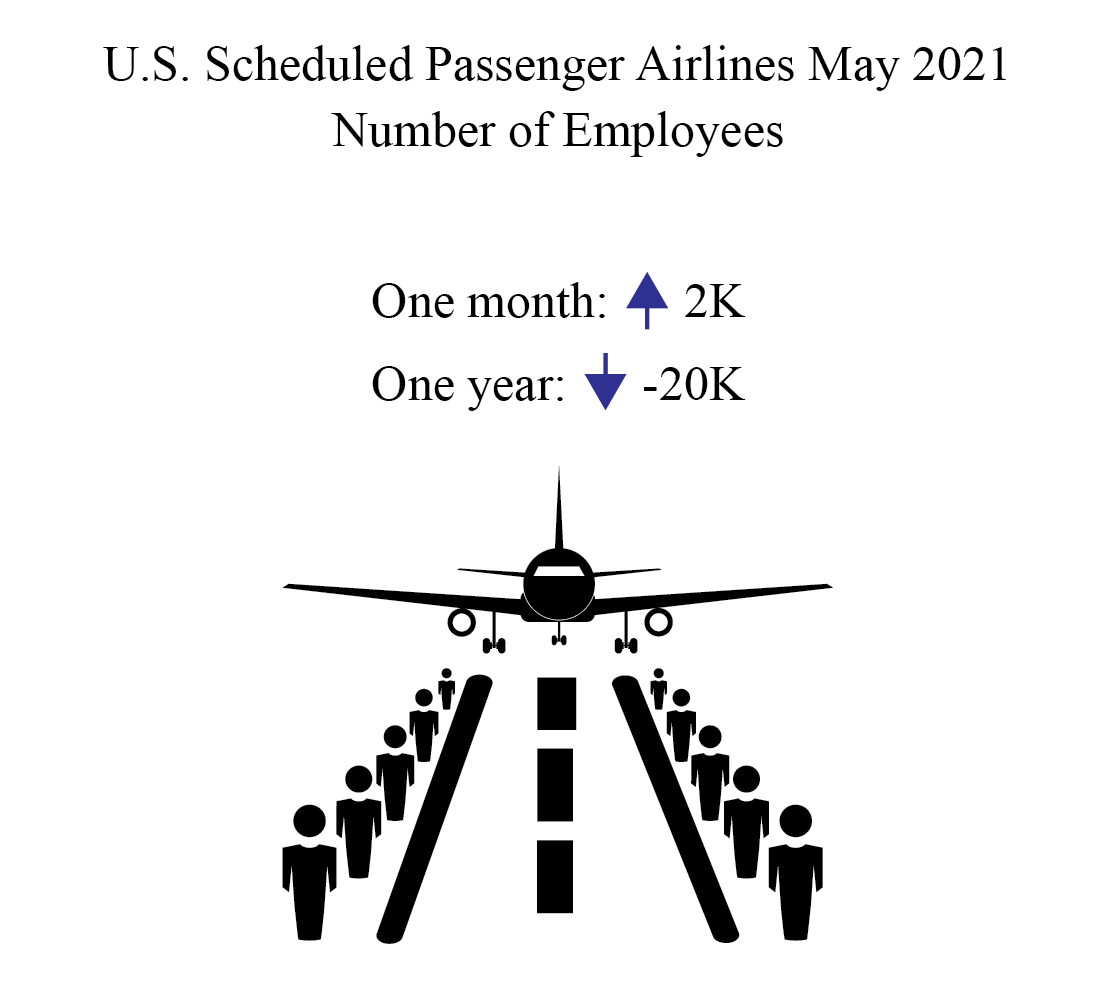
The 24 U.S. scheduled passenger airlines employed 0.7% more full-time equivalents (FTEs) in May 2021 than in April 2021:
- May’s total number of FTEs (392,984) was up 1,483 from April (391,501) and down 68,613, a 14.9% drop from the onset of the pandemic in March 2020 (461,597).
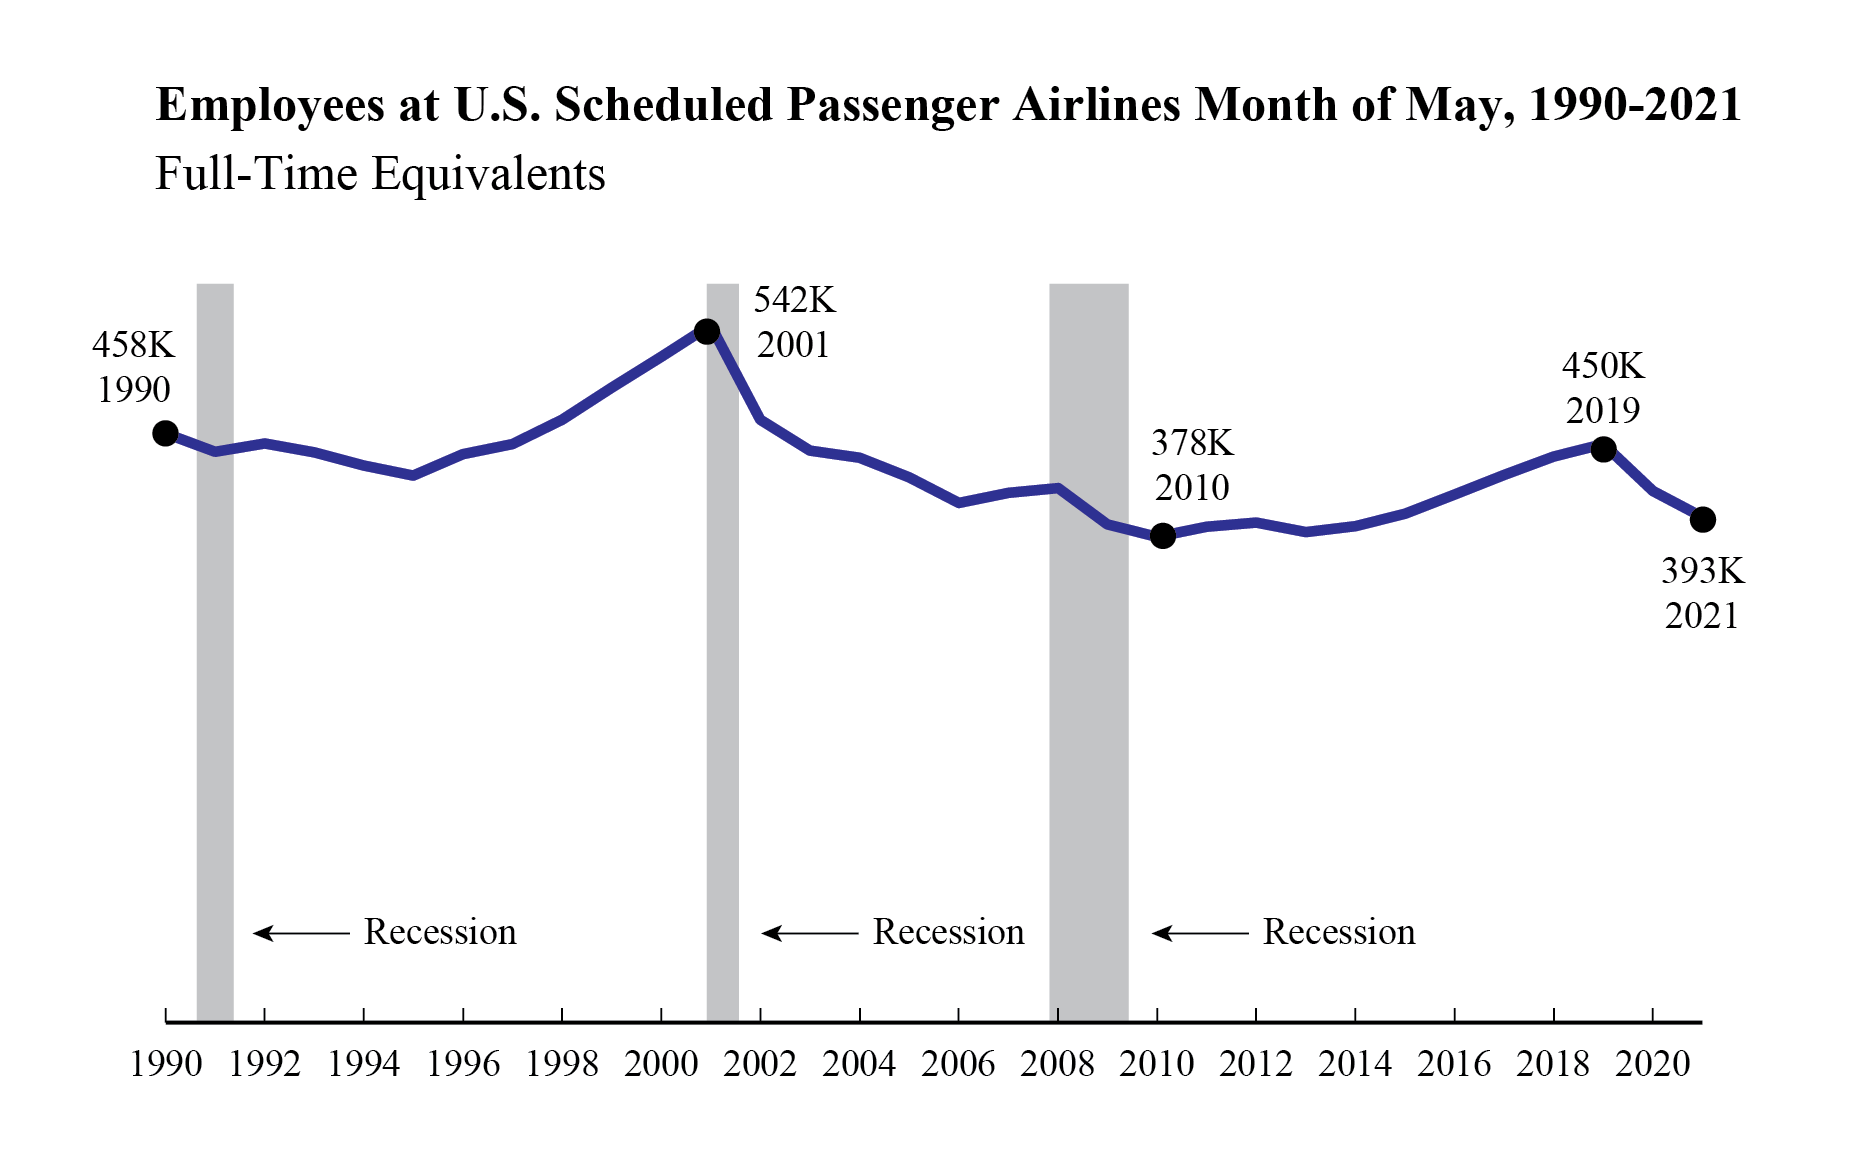
- May 2021 was the lowest FTE total for the month of May since 2015 (395,621).
The increase from April resulted primarily from Delta Air Lines increase of 2,185 FTEs. Other passenger airlines reported a combined decrease in FTEs from April to May.
Regulations require U.S. airlines to report employment numbers for employees who worked or received pay for any part of the pay period(s) ending nearest the 15th day of the month. U.S. airline employment reports are filed monthly with the Bureau of Transportation Statistics. See the tables that accompany this release on the BTS website for detailed data since 2015 (Tables 1-15) and industry summary monthly data since 1990.
All 24 scheduled service passenger airlines (May)
- 392,984 FTEs
- Down 4.9% (20,234 FTEs) from May 2020 (413,218 FTEs)
- Down 7.7% (32,672 FTEs) from May 2017 (425,656 FTEs)
Four network airlines (May)
American Airlines, Delta Air Lines, United Airlines, Alaska Airlines
- 237,071 FTEs, 60.3% of total scheduled passenger airline FTEs
- Down 4.3% (10,578 FTEs) from May 2020 (247,649 FTEs)
- Down 14.5% (40,064 FTEs) from May 2017 (277,135 FTEs)
- Up 0.7% (1,560 FTEs) from April 2021 (235,511) FTEs
Network airlines operate a significant portion of their flights using at least one hub where connections are made for flights to down-line destinations or spoke cities. Note that beginning with January 2018 data, Virgin America’s numbers are included with Alaska Airlines in the network category.
Six low-cost airlines (May)
Southwest Airlines, JetBlue Airways, Spirit Airlines, Frontier Airlines, Allegiant Air, Virgin America
- 90,047 FTEs, 22.9% of total scheduled passenger airline FTEs
- Down 8.7% (8,594 FTEs) from May 2020 (98,641 FTEs)
- Up 1.3% (1,188 FTEs) from May 2017 (88,859 FTEs)
- Down 0.4% (326 FTEs) from April 2021 (90,373) FTEs
Low-cost airlines operate under a low-cost business model, with infrastructure and aircraft operating costs below the overall industry average.
Ten regional airlines (May)
SkyWest Airlines, Envoy Air, Piedmont Airlines, Republic Airlines, Endeavor Air, PSA Airlines, Horizon Air, Mesa Airlines, Air Wisconsin Airlines, GoJet Airlines
- 57,897 FTEs, 14.7% of total scheduled passenger airline FTEs
- Up 0.2% (130 FTEs) from May 2020 (57,767 FTEs)
- Up 11.8% (6,094 FTEs) from May 2017 (51,803 FTEs)
- Down 0.9% (500 FTEs) from April 2021 (58,397 FTEs)
Regional carriers typically provide service from small cities, using primarily regional jets to support the network carriers’ hub and spoke systems.
Top Employers by Group
- Network: American 92,190 FTEs
- Low-Cost: Southwest 55,107 FTEs
- Regional: SkyWest 14,097 FTEs