Source: US DOT
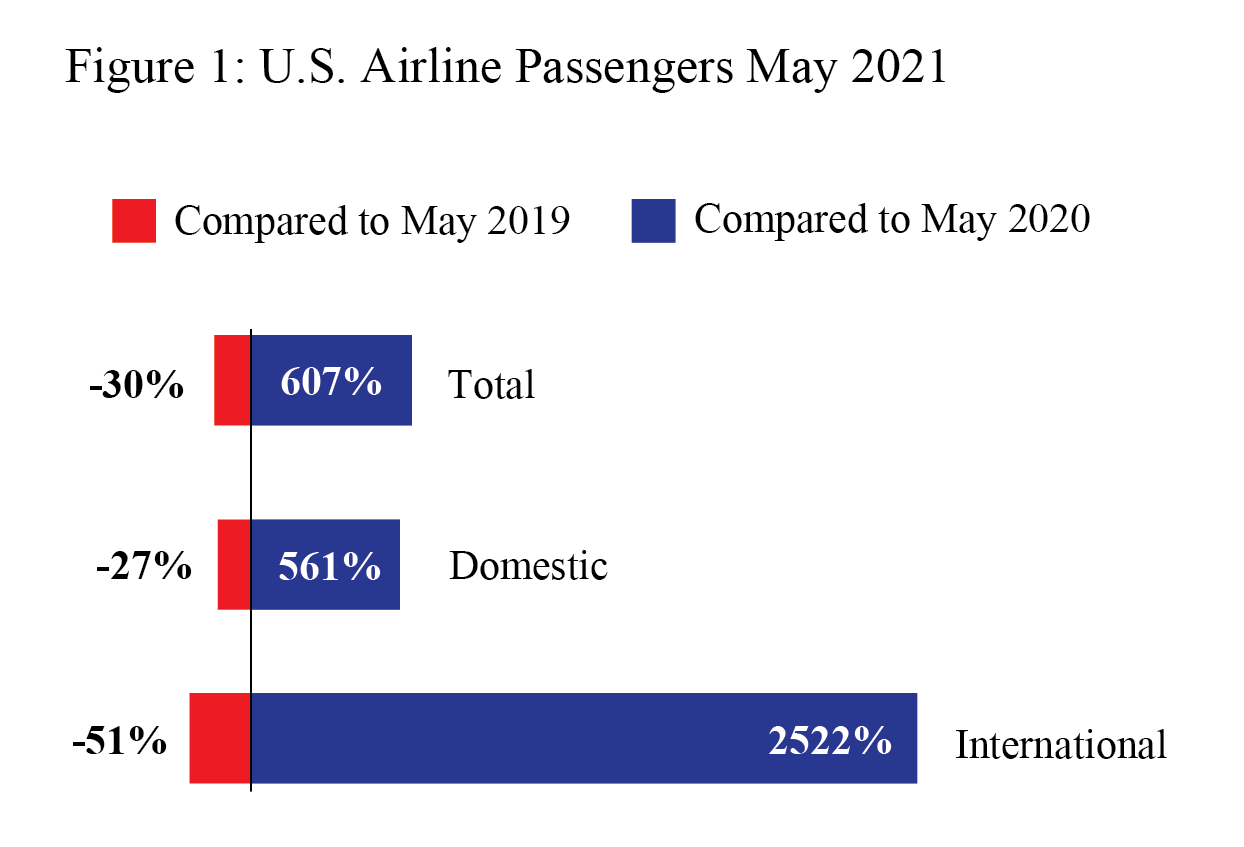
U.S. airlines carried 607% more scheduled service passengers in May 2021 than in May 2020 (preliminary), according to data filed with the Bureau of Transportation Statistics (BTS) by 18 airlines that carry more than 90% of the passengers.
The large airlines carried 56.6 million passengers in May 2021 (preliminary), compared to 8.0 million passengers in May 2020 and up from 3.0 million in April 2020, which was the lowest monthly total in BTS records dating back to 1974. The previous low was 14.6 million passengers in February 1975.
In May 2021, the large airlines carried 30% fewer total passengers, 27% fewer domestic passengers and 51% fewer international passengers than in pre-pandemic May 2019 when there were 81.0 million passengers.
The airlines carried 19% more passengers in May 2021 than in April 2021 (47.6M).
Preliminary May 2021 passenger numbers (18 carriers reporting):
- Total: 56.6 million passengers, up 607% from May 2020 (8.0 M)
- Domestic: 51.7 million passengers, up 561% from May 2020 (7.8 M)
- International: 4.9 million passengers, up 2522% from May 2020 (0.2 M)
U.S. airline traffic reports are filed monthly with BTS. Final May data will be released on Aug. 12. Complete international data by origin and destination, which is under a six-month confidentiality restriction, will be released on Nov. 12.
Systemwide Passengers
- May 2021 passengers: 6M
- Change from May 2020: 607%
- Percent of 2020 passengers: 707%
- Change from April 2020 low: +53.6M passengers
Table 1: Systemwide Percent Change in US Airlines Scheduled Service Passengers from the Same Month of the Previous Year, 2017-2021
| Year-to-Year Percent Change | ||||
| 2017 – 2018 | 2018 – 2019 | 2019 – 2020 | 2020 – 2021 | |
| January | 3.0 | 5.2 | 5.7 | -61.5 |
| February | 5.8 | 4.2 | 6.7 | -60.8 |
| March | 4.6 | 6.4 | -51.3 | 9.5 |
| April | 6.0 | 3.9 | -96.1 | 1,492.3 |
| May | 6.1 | 5.3 | -90.1 | 606.5* |
| June | 6.2 | 3.7 | -80.3 | |
| July | 6.4 | 3.7 | -72.4 | |
| August | 6.3 | 3.5 | -69.8 | |
| September | 7.1 | 5.7 | -65.2 | |
| October | 5.0 | 4.2 | -61.8 | |
| November | 5.7 | 0.5 | -60.7 | |
| December | 4.8 | 8.9 | -61.5 | |
| Jan – May | 5.1 | 5.0 | -48.8 | 6.6 |
| Annual | 5.6 | 4.6 | -60.2 | |
Domestic Passengers
- May 2021 passengers: 7M
- Change from May 2020: 561%
- Percent of 2020 passengers: 661%
- Change from May 2019: -27%
- Domestic percent of total May 2021 passengers: 91%
- Domestic percent of total May 2020 passengers: 98%
Table 2: Domestic Percent Change in US Airlines Scheduled Service Passengers from the Same Month of the Previous Year, 2017-2021
| Year-to-Year Percent Change | ||||
| 2017 – 2018 | 2018 – 2019 | 2019 – 2020 | 2020 – 2021 | |
| January | 3.3 | 5.3 | 6.2 | -60.6 |
| February | 6.0 | 4.2 | 7.5 | -59.1 |
| March | 4.2 | 6.7 | -51.0 | 14.3 |
| April | 7.0 | 3.8 | -95.7 | 1,426.5 |
| May | 6.6 | 5.3 | -89.0 | 560.7* |
| June | 6.6 | 3.6 | -77.9 | |
| July | 7.2 | 3.9 | -69.6 | |
| August | 6.9 | 3.5 | -67.1 | |
| September | 7.2 | 5.9 | -62.7 | |
| October | 5.0 | 4.3 | -59.9 | |
| November | 5.8 | 0.3 | -59.4 | |
| December | 5.0 | 9.6 | -60.9 | |
| Jan – May | 5.4 | 5.1 | -48.3 | 10.3 |
| Annual | 5.9 | 4.6 | -58.7 | |
International Passengers
- May 2021 passengers: 9M
- Change from May 2020: 2522%
- Percent of 2020 passengers: 2622%
- Change from May 2019: -51%
- International percent of total May 2021 passengers: 9%
- International percent of total May 2020 passengers: 2%
Table 3: International Percent Change in US Airlines Scheduled Service Passengers from the Same Month of the Previous Year, 2017-2021
| Year-to-Year Percent Change | ||||
| 2017 – 2018 | 2018 – 2019 | 2019 – 2020 | 2020 – 2021 | |
| January | 1.3 | 4.8 | 2.1 | -67.5 |
| February | 4.8 | 3.8 | 1.0 | -73.4 |
| March | 7.4 | 3.8 | -53.3 | -25.7 |
| April | -0.6 | 4.7 | -98.6 | 2,923.3 |
| May | 2.7 | 5.7 | -98.1 | 2,521.9* |
| June | 3.7 | 4.3 | -96.4 | |
| July | 1.9 | 2.3 | -90.4 | |
| August | 2.5 | 3.9 | -87.5 | |
| September | 6.3 | 4.7 | -83.7 | |
| October | 4.6 | 3.4 | -77.3 | |
| November | 5.0 | 2.4 | -70.3 | |
| December | 3.6 | 4.0 | -66.0 | |
| Jan – May | 3.1 | 4.6 | -52.2 | -20.9 |
| Annual | 3.5 | 4.0 | -70.4 | |