Source: US DOT
The 23 U.S. scheduled passenger airlines employed 2.1% more full-time equivalents (FTEs) in July 2021 than in June 2021:
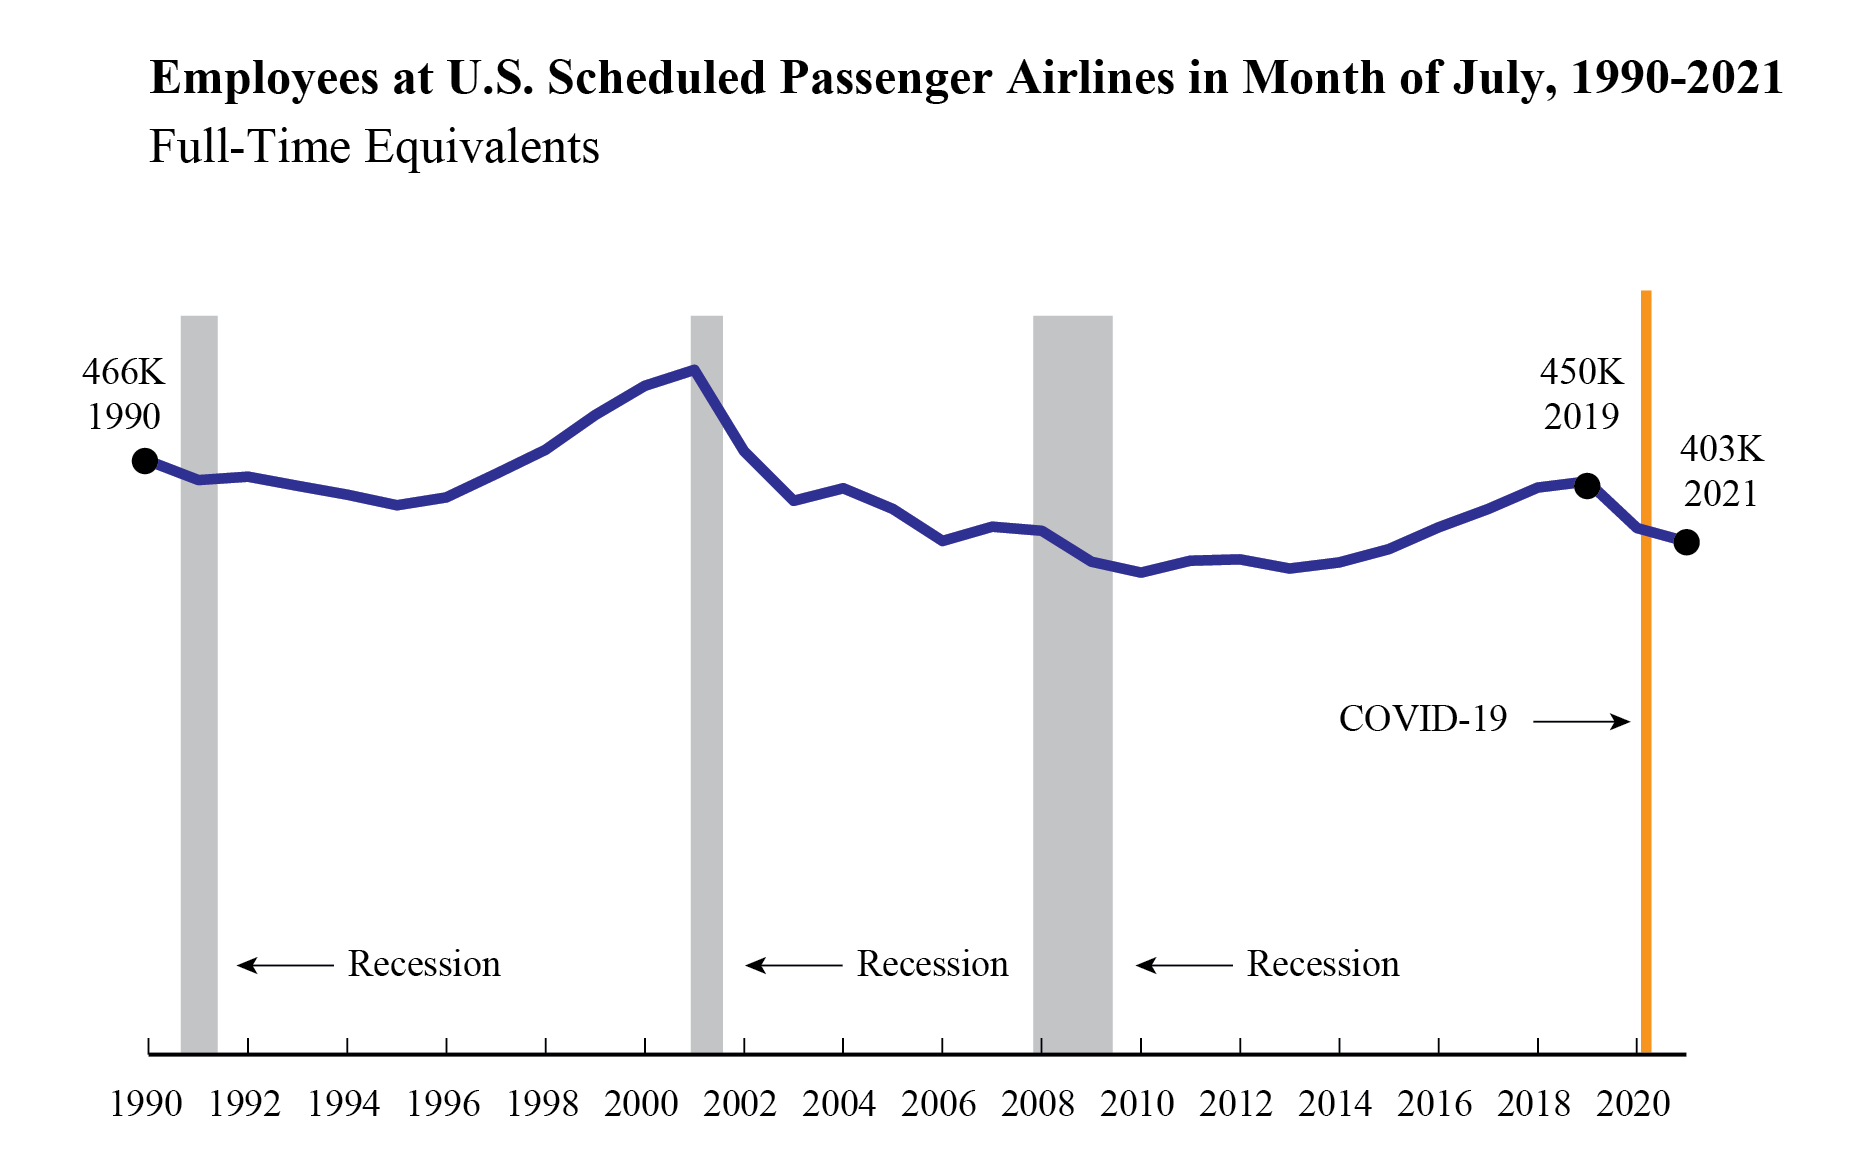
- July’s total number of FTEs (402,561) was up 8,263 from June (394,298) and down 54,699, a 12.0% drop from the onset of the pandemic in March 2020 (457,260) and a 10.5% drop from the most recent pre-pandemic corresponding month, July 2019.
- July 2021 was the lowest FTE total for the month of July since 2015 (396,503).
The largest increase in passenger airlines employees came from Delta Airlines adding 6,413 FTEs. In July 2021, scheduled passenger airlines employed 56% of the total airline industry FTEs, which includes cargo and charter carriers. In pre-pandemic March 2020, scheduled passenger airlines employed 63% of the total airline industry.
Regulations require U.S. airlines to report employment numbers for employees who worked or received pay for any part of the pay period(s) ending nearest the 15th day of the month. U.S. airline employment reports are filed monthly with the Bureau of Transportation Statistics. See the tables that accompany this release on the BTS website for detailed data since 2015 (Tables 1-15) and industry summary monthly data since 1990.
All 23 scheduled service passenger airlines (mid-July)
- 402,561 FTEs
- Down 2.5% (10,495 FTEs) from July 2020 (413,056 FTEs)
- Down 10.5% (47,243 FTEs) from July 2019 (449,804 FTEs)
- Up 2.1% (8,263) from June 2021 (394,298 FTEs)
Four network airlines (mid-July)
American Airlines, Delta Air Lines, United Airlines, Alaska Airlines
- 246,418 FTEs, 61.2% of total scheduled passenger airline FTEs
- Down 2.4% (6,118 FTEs) from July 2020 (252,536 FTEs)
- Down 14.7% (42,520 FTEs) from July 2019 (288,938 FTEs)
- Up 3.3% (7,963 FTEs) from June 2021 (238,455) FTEs
Network airlines operate a significant portion of their flights using at least one hub where connections are made for flights to down-line destinations or spoke cities. Note that, beginning with January 2018 data, Virgin America’s numbers are included with Alaska Airlines in the network category.
Five low-cost airlines (mid-July)
Southwest Airlines, JetBlue Airways, Spirit Airlines, Frontier Airlines, Allegiant Air
- 89,756 FTEs, 22.3% of total scheduled passenger airline FTEs
- Down 8.5% (8,286 FTEs) from July 2020 (98,042 FTEs)
- Down 6.3% (6,020 FTEs) from July 2019 (95,776 FTEs)
- Down 0.1% (103 FTEs) from June 2021 (89,859) FTEs
Low-cost airlines operate under a low-cost business model, with infrastructure and aircraft operating costs below the overall industry average.
Ten regional airlines (mid-July)
SkyWest Airlines, Envoy Air, Piedmont Airlines, Republic Airlines, Endeavor Air, PSA Airlines, Horizon Air, Mesa Airlines, Air Wisconsin Airlines, GoJet Airlines
- 58,280 FTEs, 14.5% of total scheduled passenger airline FTEs
- Up 9.2% (4,913 FTEs) from July 2020 (53,367 FTEs)
- Up 2.42% (1,359 FTEs) from July 2019 (56,921 FTEs)
- Up 0.5% (310 FTEs) from June 2021 (57,970 FTEs)
Regional carriers typically provide service from small cities, using primarily regional jets to support the network carriers’ hub and spoke systems.
Top Employers by Group
- Network: American 93,642 FTEs
- Low-Cost: Southwest 54,005 FTEs
- Regional: SkyWest 14,126 FTEs
Four other airlines included in industry totals
Other carriers generally operate within specific niche markets. They are Hawaiian Airlines, Sun Country Airlines, Silver Airlines and Eastern Airlines.