Source: US DOT
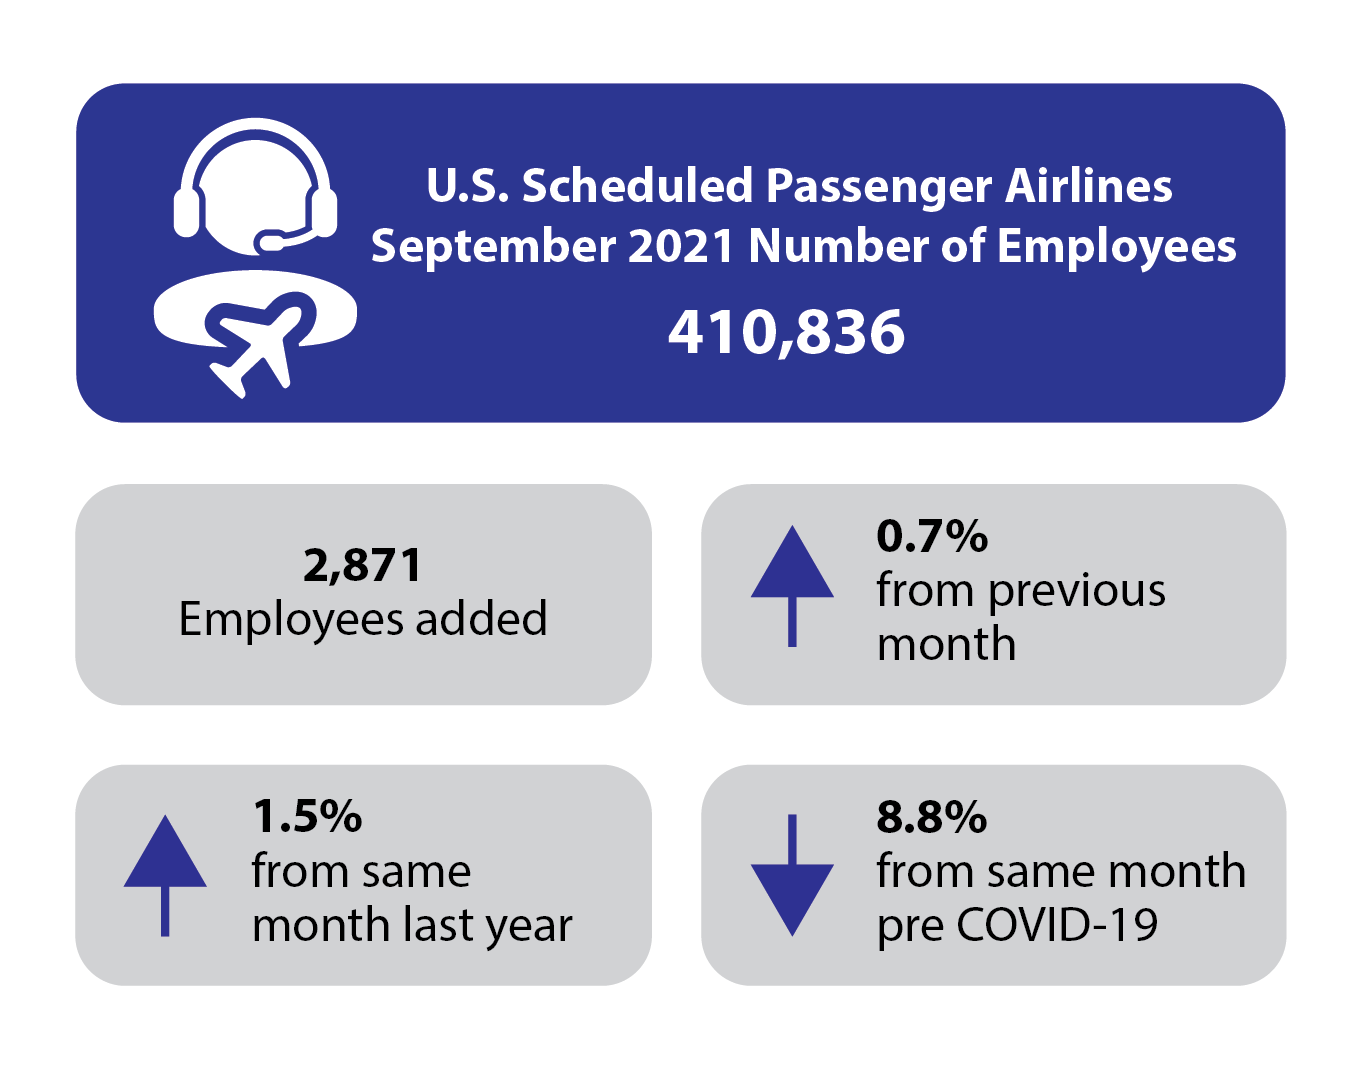
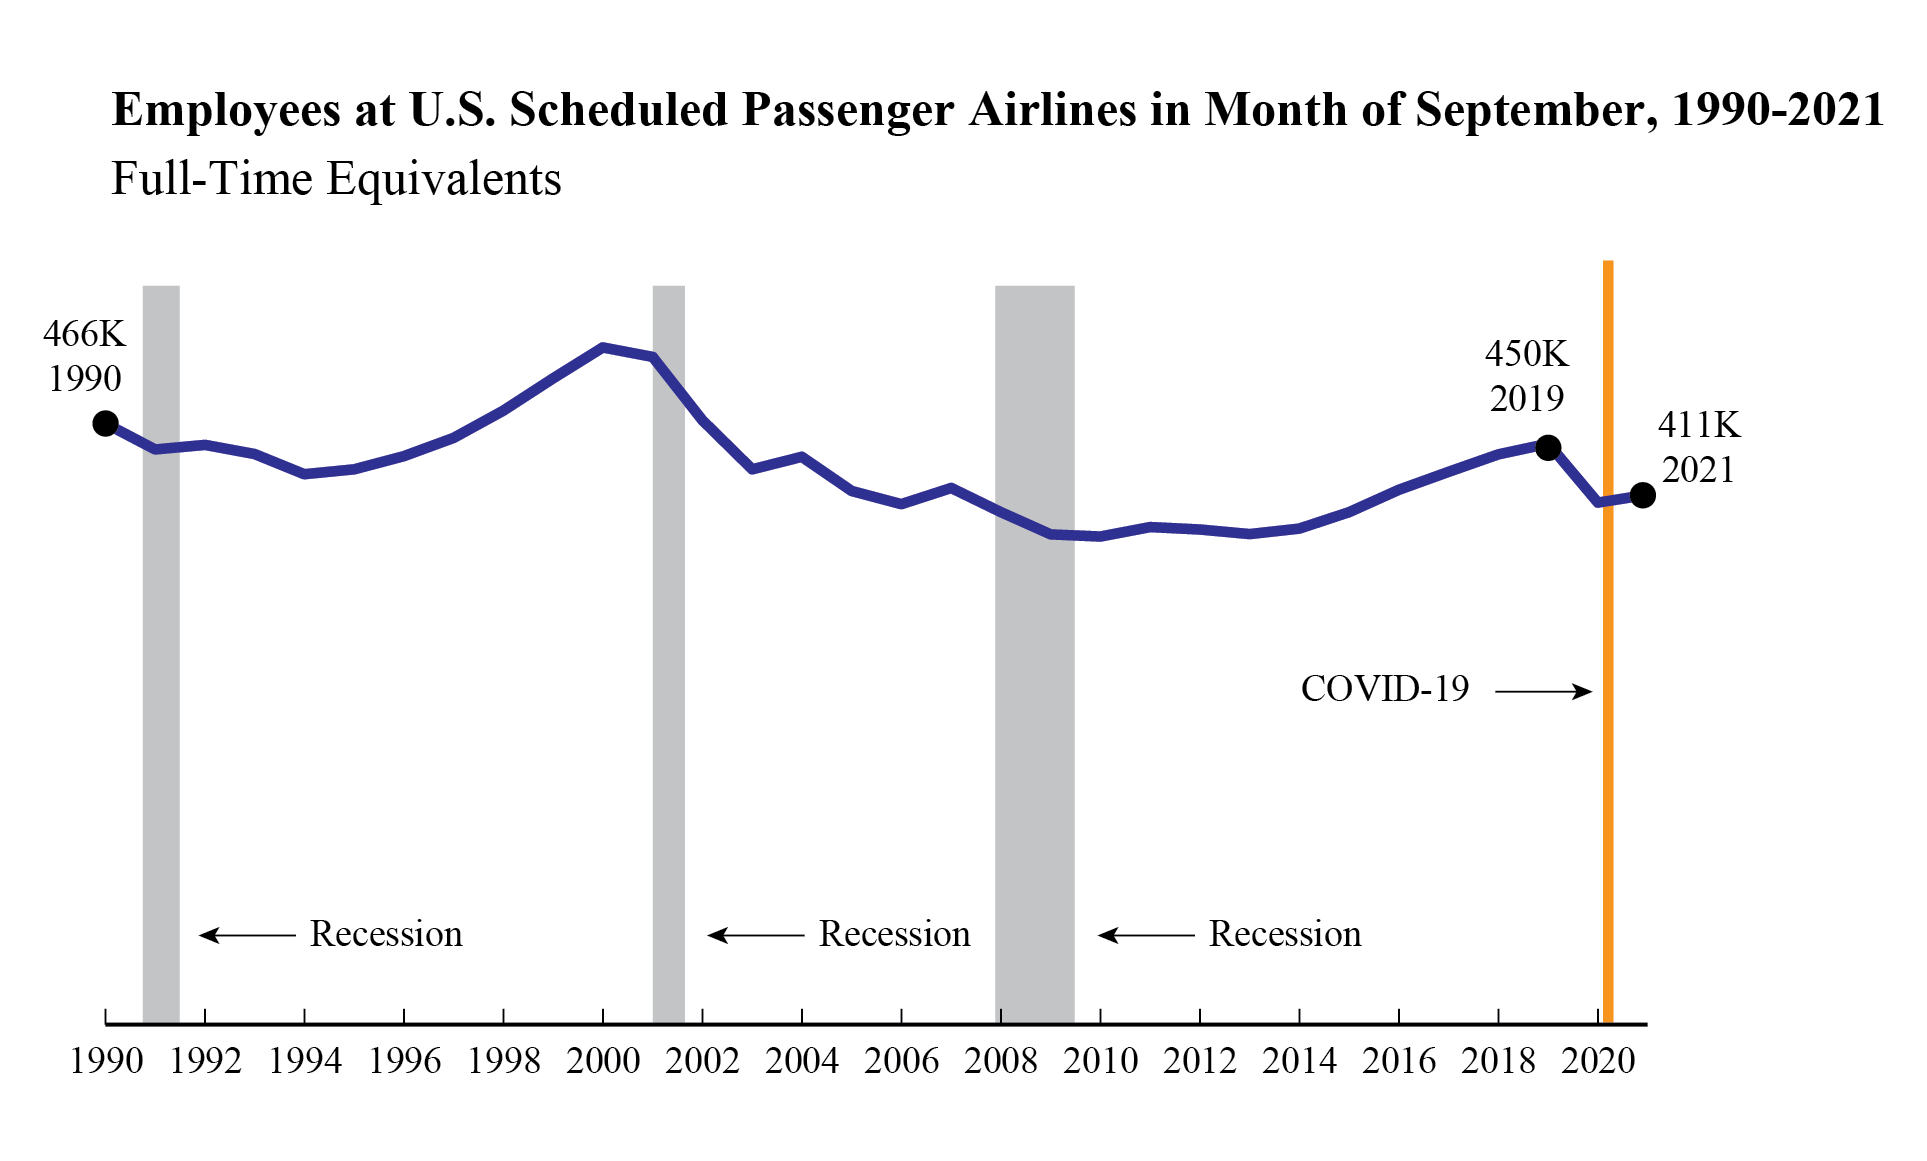
The 24 U.S. scheduled passenger airlines employed 0.7% more full-time equivalents (FTEs) in September 2021 than in August 2021, but still employed 8.8% fewer than in pre-pandemic September 2019. The September total number of FTEs (410,836) was up 2,871 from August (407,965) and down 39,618 from September 2019 (450,454). In September 2021, the airlines employed the lowest FTE total for the month of September since 2015 (397,326).
The September uptick resulted in part from increases of 2,343 FTEs at Delta Airlines and 1,150 at United Airlines. Only 4 of the 24 reporting airlines had fewer FTEs in September than in August, led by American Airlines (down 1,811 FTEs) and Alaska Airlines (down 850).
In September 2021, scheduled passenger airlines employed 62% of total airline industry FTEs, down from 63% at the onset of the pandemic in March 2020. The total airline industry includes cargo and charter.
Regulations require U.S. airlines to report employment numbers for employees who worked or received pay for any part of the pay period(s) ending nearest the 15th day of the month. U.S. airline employment reports are filed monthly with the Bureau of Transportation Statistics. See the tables that accompany this release on the BTS website for detailed data since 2015 (Tables 1-15) and industry summary monthly data since 1990.
All 24 scheduled service passenger airlines (mid-September)
- 410,836 FTEs
- Up 1.5% (6,072 FTEs) from September 2020 (404,764 FTEs)
- Down 8.8% (39,618 FTEs) from September 2019 (450,454 FTEs)
Four network airlines (mid-September)
American Airlines, Delta Air Lines, United Airlines, Alaska Airlines
- 251,973 FTEs, 61.3% of total scheduled passenger airline FTEs
- Up 1.0% (2,408 FTEs) from September 2020 (249,565 FTEs)
- Up 0.3% (851 FTEs) from August 2021 (251,122) FTEs
Two of the four network airlines added FTEs in September. Network airlines operate a significant portion of their flights using at least one hub where connections are made for flights to down-line destinations or spoke cities. Note that beginning with January 2018 data, Virgin America’s numbers are included with Alaska Airlines in the network category.
Five low-cost airlines (mid-September)
Southwest Airlines, JetBlue Airways, Spirit Airlines, Frontier Airlines, Allegiant Air
- 90,758 FTEs, 22.1% of total scheduled passenger airline FTEs
- Down 3.0% (2,826 FTEs) from September 2020 (93,584 FTEs)
- Up 1.0% (870 FTEs) from August 2021 (89,888) FTEs
All five low-cost airlines added FTEs in September 2021. Low-cost airlines operate under a low-cost business model, with infrastructure and aircraft operating costs below the overall industry average.
Ten regional airlines (mid-July)
SkyWest Airlines, Envoy Air, Piedmont Airlines, Republic Airlines, Endeavor Air, PSA Airlines, Horizon Air, Mesa Airlines, Air Wisconsin Airlines, GoJet Airlines
- 59,525 FTEs, 14.5% of total scheduled passenger airline FTEs
- Up 12.9% (6,818 FTEs) from September 2020 (52,707 FTEs)
- Up 12.6% (6,654 FTEs) from September 2017 (52,871 FTEs)
- Up 1.2% (724 FTEs) from August 2021 (58,801 FTEs)
Eight of the 10 regional carriers added FTEs in September. Regional carriers typically provide service from small cities, using primarily regional jets to support the network carriers’ hub and spoke systems.
Top Employers by Group
- Network: American 92,006 FTEs
- Low-Cost: Southwest 53,984 FTEs
- Regional: SkyWest 14,757 FTEs
Four other airlines included in industry totals
Other carriers generally operate within specific niche markets. They are Hawaiian Airlines, Sun Country Airlines, Silver Airlines and Eastern Airlines.
Reporting Notes
Airlines that operate at least one aircraft that has more than 60 seats or the capacity to carry a payload of passengers, cargo and fuel weighing more than 18,000 pounds must report monthly employment statistics.