
Source: US Department of Transportation
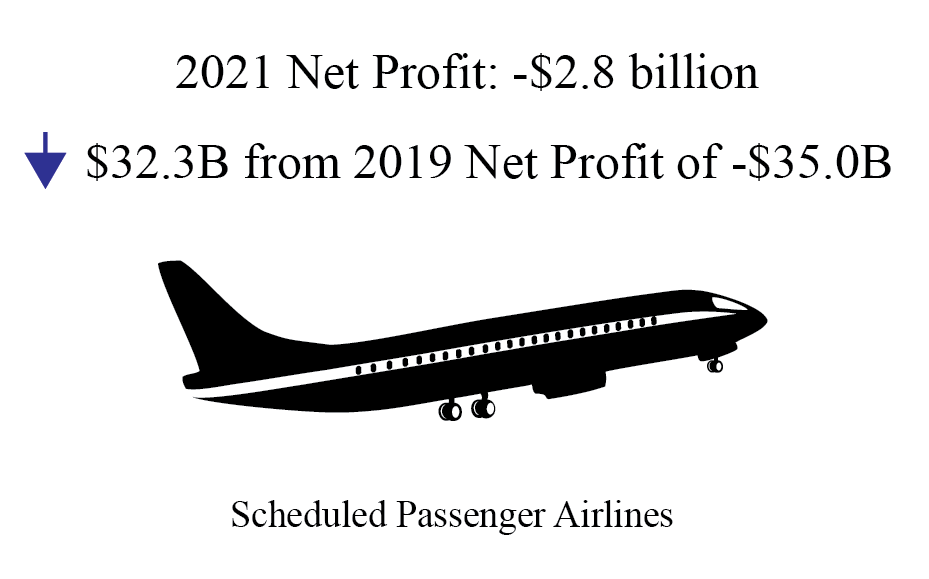
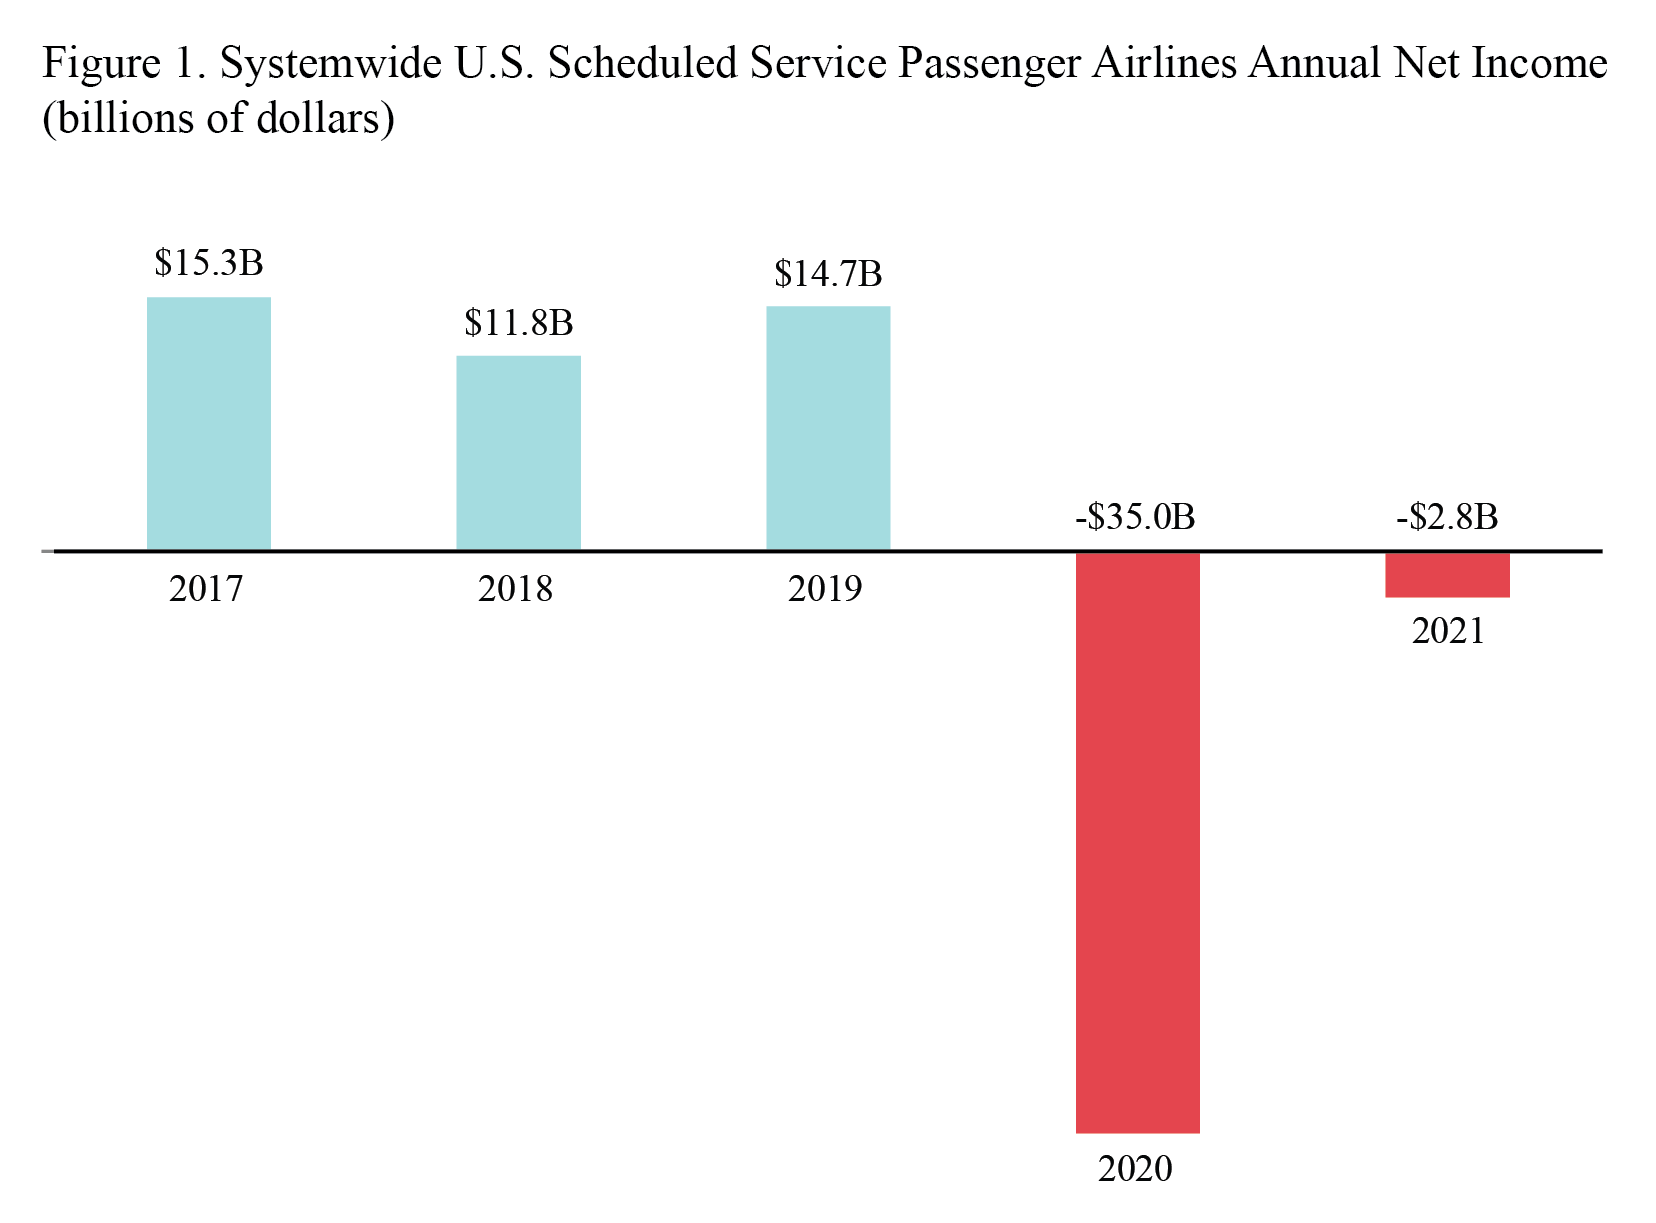
U.S. scheduled passenger airlines reported a 2021 after-tax net loss of $2.8 billion, declining for the second straight year after seven consecutive annual after-tax profits and a pre-tax operating loss of $17.3 billion, declining for the second straight year after 11 consecutive annual pre-tax profit.
U.S. airline financial reports are filed quarterly with the Bureau of Transportation Statistics (BTS). See the tables that accompany this release on the BTS website for additional 2020 annual (Tables 1-6) and fourth-quarter (Tables 7-12) financial results.
2021 Annual Results for All 25 Scheduled Passenger Airlines
After-tax net income
- $2.8 billion loss in 2021
- Compared to $35.0 billion loss in 2020
Pre-tax operating profit/loss
- $17.3 billion loss in 2021
- Compared to $46.5 billion loss in 2020
- Total 2021 operating revenue: $130.0 billion
Share of total 2021 operating revenue:
- Fares: $86.7 billion, 66.7%, compared to 64.5% in 2020
- Baggage fees: $5.3 billion, 4.1%, compared to 3.7% in 2020
- Reservation change fees: $698 million, 0.5%, compared to 1.2% in 2020
Fees are included for calculations of net income, operating revenue and operating profit or loss.
- Total operating expenses: $147.3 billion
Share of total 2021 operating expenses:
- Fuel: $23.0 billion 15.6%, compared to 9.8% in 2020
- Labor: $52.6 billion 35.7%, compared to 39.7% in 2020
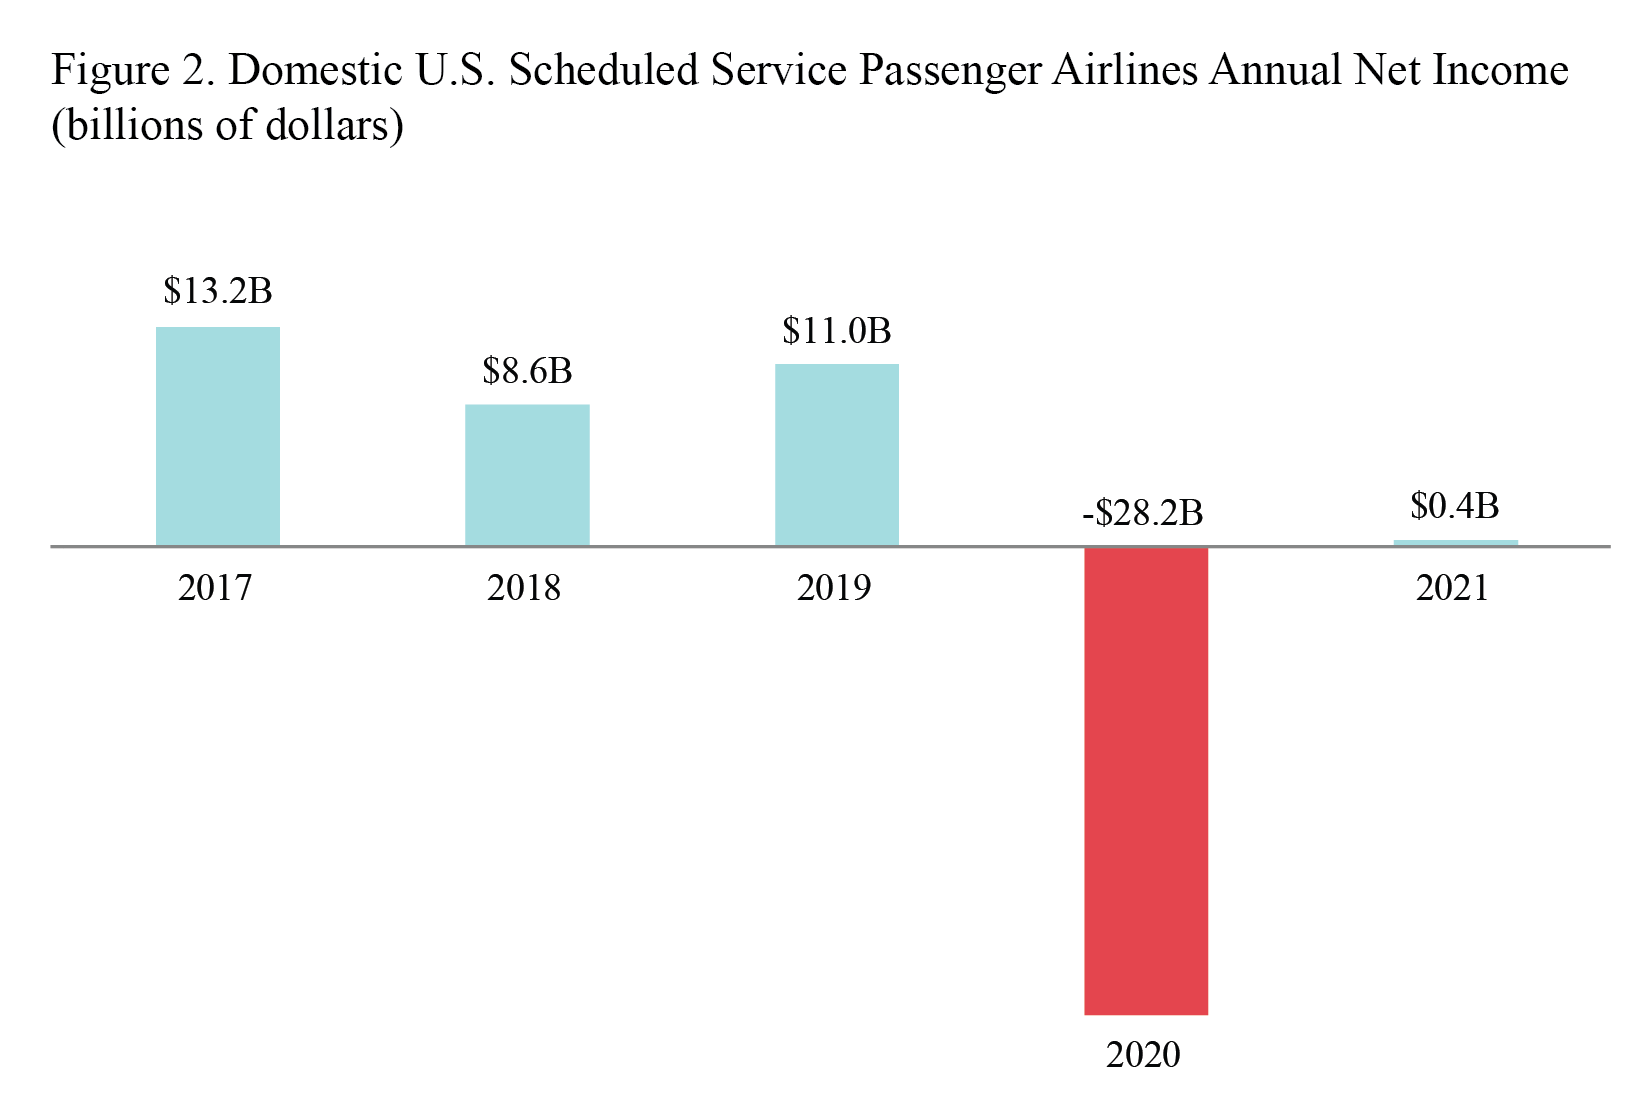
Domestic results for 25 scheduled airlines
After-tax domestic net income
- $383 million profit in 2021
- Compared to $28.2 billion loss in 2020
Pre-tax domestic operating profit/loss
- $12.2 billion loss in 2021
- Compared to $39.7 billion loss in 2020
- 2021 domestic operating revenue: $107.3 billion
Share of total 2021 domestic operating revenue:
- Fares: $71.4 billion, 66.5%, compared to 63.9% in 2020
- Baggage fees: $4.3 billion, 4.0%, compared to 3.7% in 2020
- Reservation change fees: $610 million, 0.6%, compared to 1.1% in 2020
Fees are included for calculations of net income, operating revenue and operating profit or loss.
- 2021 domestic operating expenses: $119.5 billion
Share of total 2021 domestic operating expenses:
- Fuel: $17.4 billion, 14.5%, compared to 8.8% in 2020
- Labor: $41.9 billion, 35.0%, compared to 38.9% in 2020
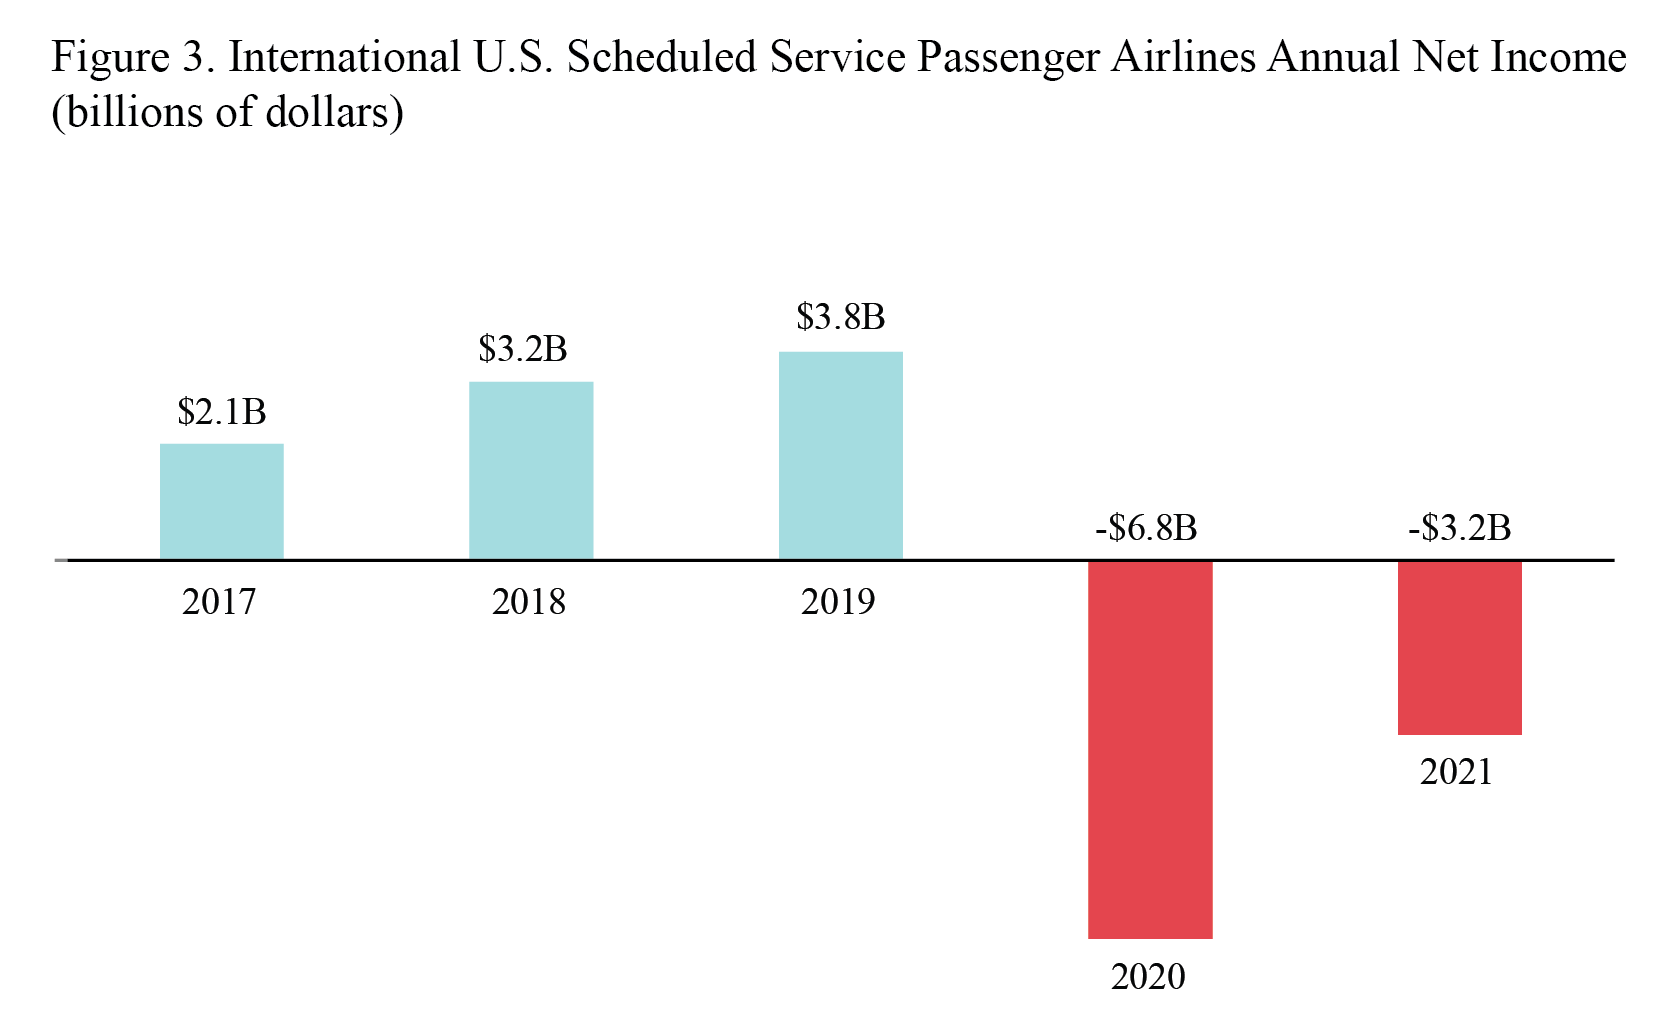
International results for 19 scheduled U.S. airlines
After-tax international net income
- $3.2 billion loss in 2021
- Compared to $6.8 billion loss in 2020
Pre-tax international operating profit
- $5.2 billion loss in 2021
- Compared to $6.8 billion loss in 2020
- 2021 international operating revenue: $22.7 billion
Share of total 2021 international operating revenue:
- Fares: $15.3 billion, 67.6%, compared to 67.2% in 2020
- Baggage fees: $998 million, 4.4%, compared to 3.4% in 2020
- Reservation change fees: $88 million, 0.4%, compared to 1.5% in 2020
Fees are included for calculations of net income, operating revenue and operating profit or loss.
- 2021 international operating expenses: $27.8 billion
Share of total 2021 international operating expenses:
- Fuel: $5.6 billion, 20.2%, compared to 14.7% in 2020
- Labor: $10.7 billion, 38.5%, compared to 43.1% in 2020
2021 Margins
Net margin is the net income or loss as a percentage of operating revenue. Operating margin is the operating profit or loss as a percentage of operating revenue.
Systemwide:
Net income margin:
- -2.1% in 2021
- Compared to -45.3% in 2020
Operating margin:
- -13.3% in 2021
- Compared to -60.1% in 2020
Domestic
Net income margin:
- 4% in 2021
- Compared to -45.2% in 2020
Operating margin:
- -11.3% in 2021
- Compared to -63.5% in 2020
International
Net income margin:
- -13.9% in 2021
- Compared to -45.9% in 2020
Operating margin:
- -22.8% in 2021
- Compared to -45.9% in 2020
4Q 2021 Results for All 25 Scheduled U.S. Passenger Airlines
U.S. scheduled passenger airlines reported a fourth-quarter 2021 after-tax net loss of $2.2 billion and a pre-tax operating loss of $894 million.
One year earlier, in the fourth quarter of 2020, the airlines reported an after-tax net loss of $7.0 billion and a pre-tax operating loss of $9.7 billion.
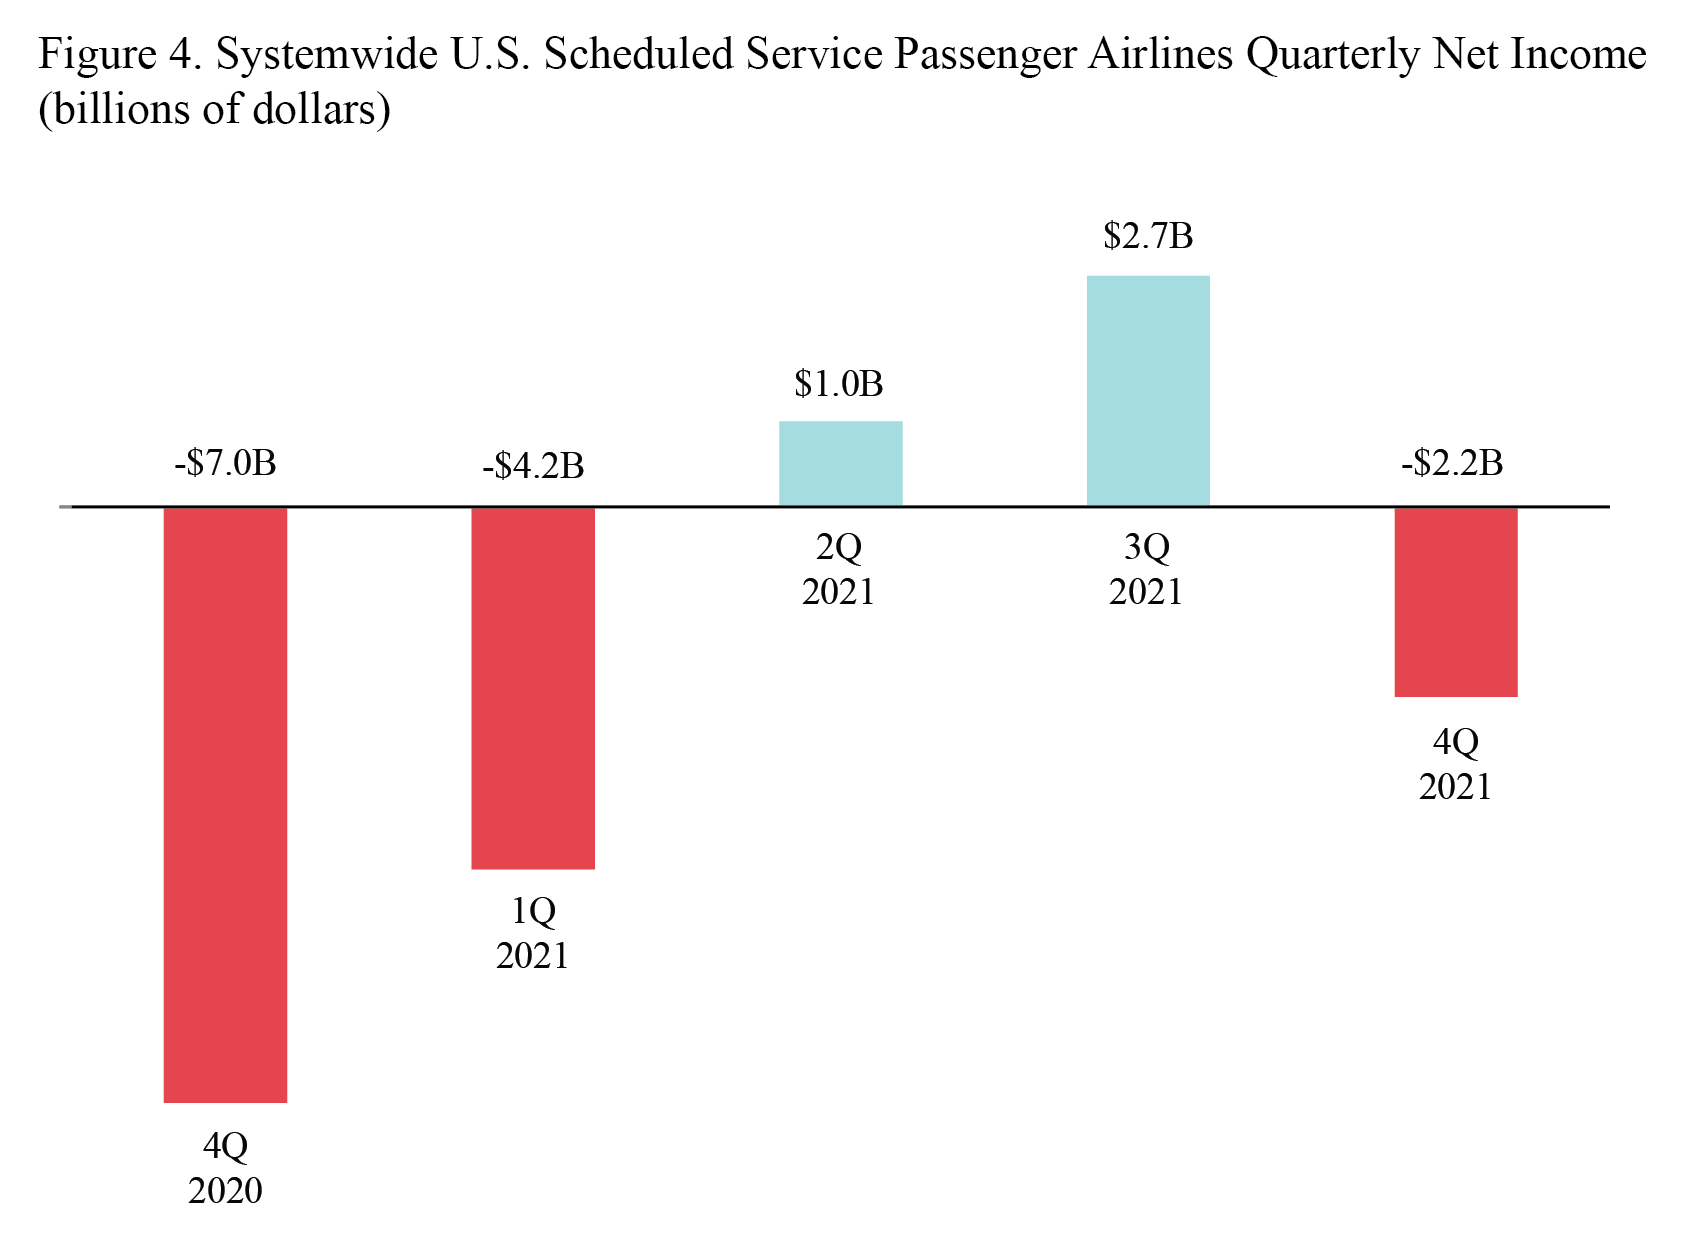
After-tax net income
- $2.2 billion loss in 4Q 2021
- Compared to $2.7 billion profit in 3Q 2021
- Compared to $7.0 billion loss in 4Q 2020
Pre-tax operating profit
- $894 million loss in 4Q 2021
- Compared to $187 million loss in 3Q 2021
- Compared to $9.7 billion loss in 4Q 2020
- Total 4Q 2021 operating revenue: $41.2 billion
Share of total 4Q 2021 operating revenue:
- Fares: $28.4 billion, 69.0%, compared to 60.1% in 4Q 2020
- Baggage fees: $1.5 billion, 3.7%, compared to 4.4% in 4Q 2020
- Reservation change fees: $226 million, 0.6%, compared to 0.6% in 4Q 2020
Fees are included for calculations of net income, operating revenue and operating profit or loss.
- Total 4Q 2021 operating expenses: $42.1 billion:
Share of total 4Q 2021 operating expenses:
- Fuel: $7.3 billion, 17.4%, compared to 9.2% in 4Q 2020
- Labor: $14.7 billion, 34.9%, compared to 39.2% in 4Q 2020
Domestic operations, includes 25 U.S. airlines:
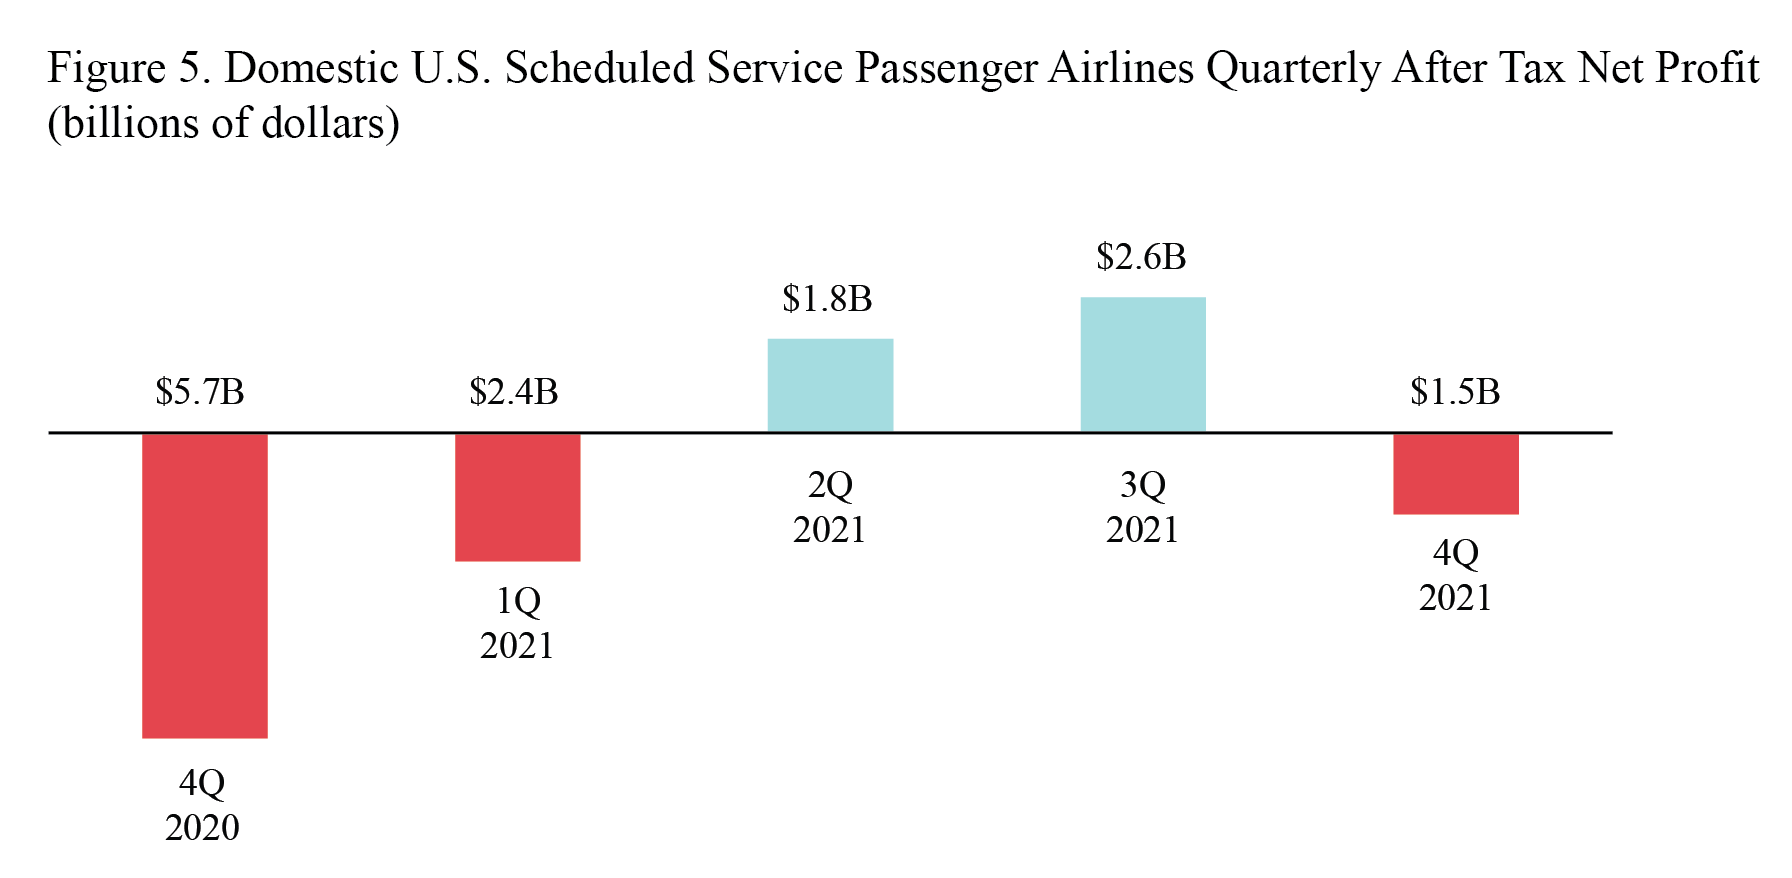
After-tax domestic net profit (net income)
- $1.5 billion loss in 4Q 2021
- Compared to $2.6 billion profit in 3Q 2021
- Compared to $5.7 billion loss in 4Q 2020
Pre-tax domestic operating profit
- $484 million loss in 4Q 2021
- Compared to $81 million profit in 3Q 2021
- Compared to $8.0 billion loss in 4Q 2020
- 4Q 2021 domestic operating revenue: $33.8 billion
Share of total 4Q 2021 domestic operating revenue:
- Fares: $23.2 billion, 68.6%, compared to 61.4% in 4Q 2020
- Baggage fees: $1.2 billion, 3.7%, compared to 4.3% in 4Q 2020
- Reservation change fees: $198 million, 0.6%, compared to 0.5% in 4Q 2020
Fees are included for calculations of net income, operating revenue and operating profit or loss.
- 4Q 2021 domestic operating expenses: $34.3 billion, of which:
Share of total 4Q 2021 domestic operating expenses:
- Fuel: $5.5 billion, 16.2%, compared to 8.2% in 4Q 2020
- Labor: $11.8 billion, 34.5%, compared to 38.1% in 4Q 2020
International operations, includes 19 U.S. airlines:
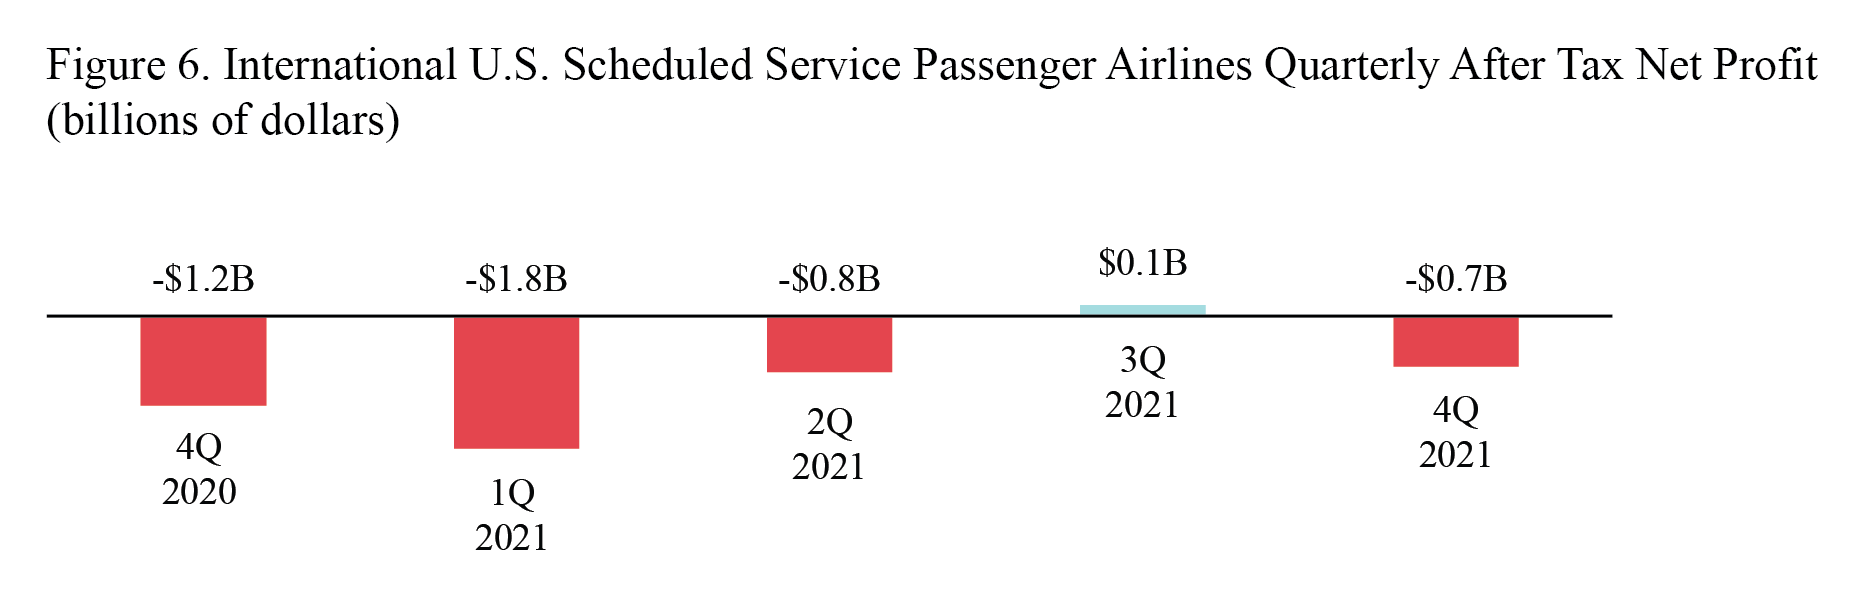
After-tax international net profit (net income)
- $697 million loss in 4Q 2021
- Compared to $149 million profit in 3Q 2021
- Compared to $1.2 billion loss in 4Q 2020
Pre-tax international operating profit
- $409 million loss in 4Q 2021
- Compared to $268 million loss in 3Q 2021
- Compared to $1.7 billion loss in 4Q 2020
- 4Q 2021 international operating revenue: $7.4 billion, of which:
Share of 4Q 2021 international operating revenue:
- Fares: $5.2 billion, 70.6%, compared to 54.5% in 4Q 2020
- Baggage fees: $290 million, 3.9%, compared to 5.0% in 4Q 2020
- Reservation change fees: $28 million, 0.5%, compared to 0.6% in 4Q 2020
Fees are included for calculations of net income, operating revenue and operating profit or loss.
- 4Q 2021 international operating expenses: $7.8 billion, of which:
Share of 4Q 2021 international operating expenses:
- Fuel: $1.8 billion, 22.7%, compared to 13.8% in 4Q 2020
- Labor: $2.8 billion, 36.5%, compared to 44.5% in 4Q 2020
4th Quarter Margins
Net margin is the net income or loss as a percentage of operating revenue. Operating margin is the operating profit or loss as a percentage of operating revenue.
Systemwide:
Net income margin:
- -5.4% in 4Q2021
- Compared to -38.8% in 4Q2020
Operating margin:
- -2.2% in 4Q2021
- Compared to -54.1% in 4Q2020
Domestic
Net income margin:
- -4.5% in 4Q2021
- Compared to -38.9% in 4Q2020
Operating margin:
- -1.4.2% in 4Q2021
- Compared to -54.2% in 4Q2020
International
Net income margin:
- -9.5% in 4Q2021
- Compared to -38.5% in 4Q2020
Operating margin:
- -5.6% in 4Q2021
- Compared to -53.3% in 4Q2020