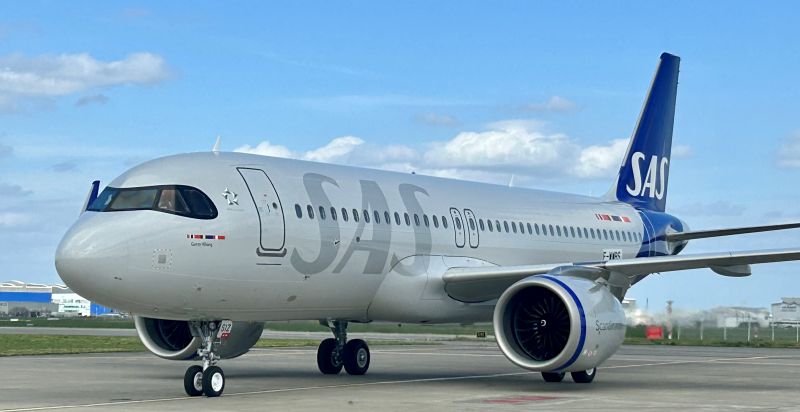
Source: SAS
The number of passengers traveling with SAS amounted to 1.9 million in March, an increase by 33 percent compared to the same period last year. SAS’ passenger demand continued its positive trend with RPK increasing by 38 percent while capacity increased by 25 percent, compared to the same period last year. The flown load factor for March was 76 percent, an improvement by 7 percentage points compared to March last year.
“Passenger demand continues its positive trend. In March, 1.9 million passengers traveled with us, up 33 percent compared to the same month last year. Our flown load factor continues to improve and reached 76 percent in March. During the month, we added ten additional routes and more frequencies for the upcoming summer and autumn. We are preparing for a busy summer season with in total 30 new routes added to the summer traffic program,” says Anko van der Werff, President & CEO of SAS.
| SAS total traffic (scheduled and charter) | Mar23 | Change1 | Nov22-Mar23 | Change1 |
| ASK (Mill.) | 3,118 | 25.4% | 14,054 | 22.1% |
| RPK (Mill.) | 2,360 | 38.0% | 9,975 | 46.8% |
| Load factor | 75.7% | 6.9 pp | 71.0% | 11.9 pp |
| No. of passengers (000) | 1,910 | 32.7% | 8,032 | 46.9% |
1 Change compared to same period last year, pp = percentage points
| Geographical development, schedule | Mar23 vs. Mar22 | Nov22-Mar23 vs. Nov21-Mar22 | ||
| RPK | ASK | RPK | ASK | |
| Intercontinental | 82.7% | 35.0% | 88.1% | 36.1% |
| Europe/Intrascandinavia | 28.7% | 27.6% | 34.5% | 18.3% |
| Domestic | 20.2% | 15.9% | 30.2% | 14.1% |
| Preliminary yield and PASK | Mar23 | Nominal change1 | FX adjusted change |
| Yield, SEK | 1.08 | 0.3% | 1.0% |
| PASK, SEK | 0.81 | 11.1% | 11.9% |
| Mar23 | |||
| Punctuality (arrival 15 min) | 69.6% | ||
| Regularity | 97.9% | ||
| Change in total CO2 emissions | 55.8% | ||
| Change in CO2 emissions per available seat kilometer, | 3.4% | ||
| Carbon offsetting of passenger related emissions | 43.8% |