Source: ACI World
- Air travel as strong as ever reveals the new edition of the industry’s most comprehensive airport traffic dataset
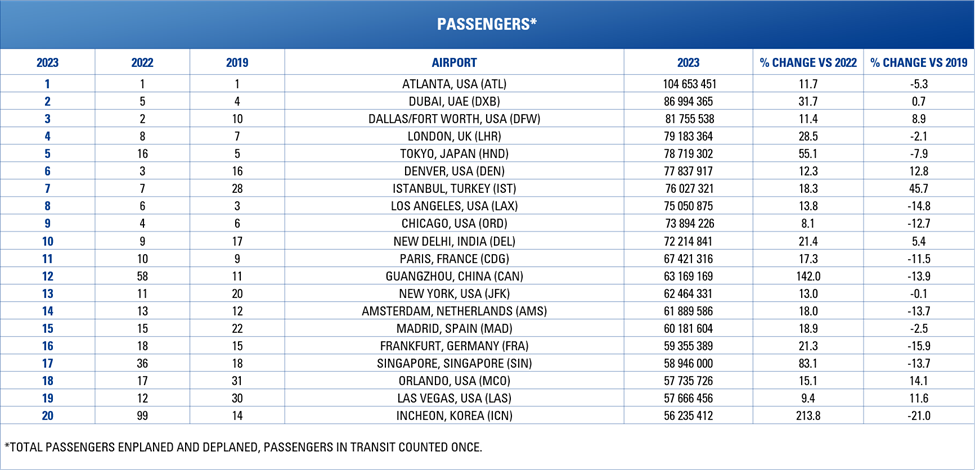
Airports Council International (ACI) World has today published the latest ACI World Airport Traffic Dataset, confirming the top 20 busiest airports in the world in 2023.
The dataset’s key findings confirm total global passenger traffic for 2023 was close to 8.7 billion, driven by a continued resurgence in international traffic. This segment was propelled by several factors, including the anticipated benefits from the reopening of the Asian markets and a growing inclination towards travel despite macroeconomic conditions.
ACI World Director General and CEO Luis Felipe de Oliveira said: “The dataset findings indicate that the demand for air travel is as strong as ever. International passenger traffic has now almost fully recovered from the pandemic, and the regional disparities are gone. China’s reopening fuelled much of 2023’s strong growth and has propelled Guangzhou Baiyun International Airport back into the Top 20. Hartsfield-Jackson Atlanta International Airport continues to lead the way, but the revival of Middle East and Asia-Pacific hubs is the standout takeaway from 2023 figures.
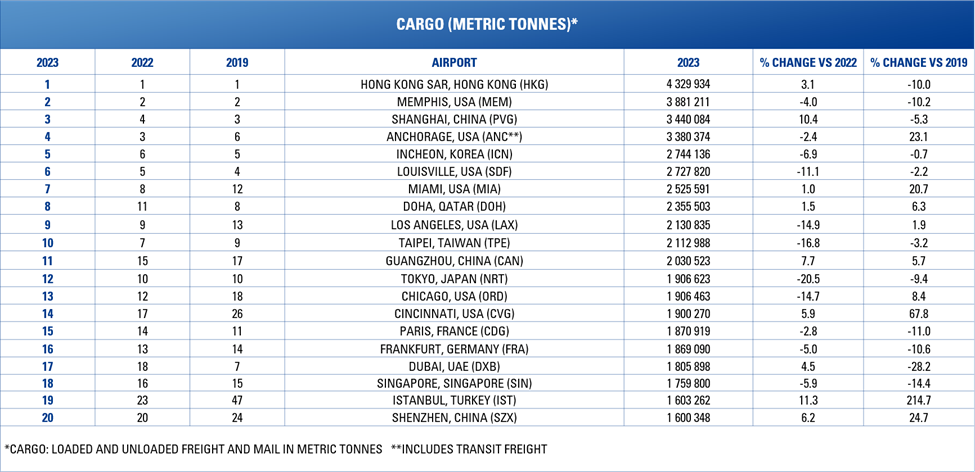
“Air cargo has decreased slightly year over year, but it is important to remember that the sector is recalibrating from the historic highs of the past few years. Cargo traffic is concentrated in the hub airports and Hong Kong retains its top spot.
“However, whatever position in the rankings an airport occupies, each is integral to the communities it serves. Airports are resilient, adaptable and support social and economic development. ACI World continues to advocate for airports worldwide to ensure their societal benefits are enjoyed by as many people as possible.”
ACI World collects airport traffic every year through its global network of airport operator members, investors, and aviation stakeholders. The dataset reveals airport passenger, cargo, and aircraft movement rankings for over 2,700 airports across more than 185 countries and territories. It allows users to filter through accurate and reliable numbers that can be segmented on a regional, national, and airport level and by traffic type.
Passengers
- Final figures indicate that 2023 global total passengers are close to 8.7 billion, representing an increase of 30.5% from 2022 or a recovery of 94.2% from pre-pandemic results (2019).
- The confirmed 2023 global total passenger figure represents a remarkable 99.88% accuracy to the figure predicted in the ACI World Annual Traffic Forecast 2023-2052 in February 2024, highlighting the reliability of ACI World’s statistics and forecasting.
- The top 20 airports representing 16% of global traffic (1.41 billion passengers), witnessed a gain of 26.4% from 2022 or a recovery of 96.8% from 2019 (1.46 billion passengers in 2019).
- Hartsfield-Jackson Atlanta International Airport is at the top of the 2023 rankings followed by Dubai International Airport and Dallas Forth Worth.
- After reaching the top of the rankings in 2020, Guangzhou Baiyun International Airport went down to 58th position in 2022 but regained 12th spot in 2023.
- Eight airports from the top 20 rankings are in the United States. Almost all have significant domestic passenger shares (between 70% and 95% domestic traffic).
- The biggest jump in the top 20 rankings was recorded by Incheon International Airport. The airport improved its ranking from 99th position in 2022 to take 20th spot in 2023.

Air Cargo
- Air cargo volumes are estimated to have decreased -1.8% year over year (-4.9% versus 2019), finishing close to 115 million tonnes in 2023.
- Air cargo traffic is more concentrated among the main airports. Air cargo volumes in the top 20 airports, representing around 42% (47.9 million tonnes) of the global volumes in 2023, dropped -3.2% in 2023 year over year but kept a gain of +1.6% vs 47.1 million tonnes in 2019.
- The decline can be attributed to the ongoing geopolitical tensions and disruptions to global trade and supply chains.
- Hong Kong remained in top spot, followed by Memphis and Shanghai Pudong.

Aircraft Movements
- 2023 global aircraft movements were close to 96 million, representing a gain of 12.6% from 2022 results or a recovery of 92.8% vs pre-pandemic results (2019).
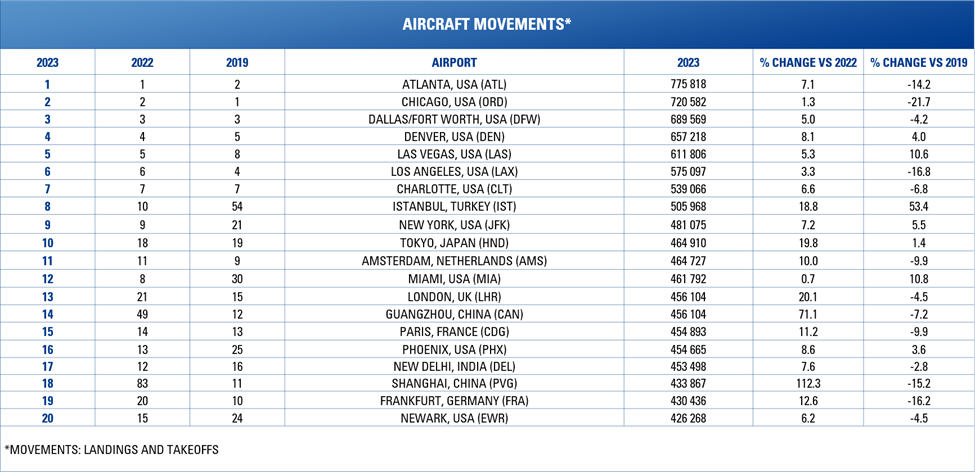
- The top 20 airports, representing close to 11% of global traffic (10.5 million movements), witnessed a gain of 12.2% from their 2022 results or a recovery of 95.3% on their 2019 results (11 million movements in 2019).
- Eleven airports from the top 20 rankings are in the United States.
- ATL is at the top with 776,000 movements, representing a recovery of 85.8% from its 2019 results (904,000 movements in 2019).
- Chicago O’Hare is in 2nd place after leading ATL in 2018 and 2019, followed by DFW.
- The biggest jump in the top 20 rankings was recorded for PVG. The airport improved its ranking from the 83rd position in 2022 to 18th in 2023.


